Waves eMotion LV1 64-Channel Mixer with Axis One Custom Computer User Manual
Page 42
37
Waves eMotion LV1 User Guide |
Chapte
r
1:
Setup
Window
DSP
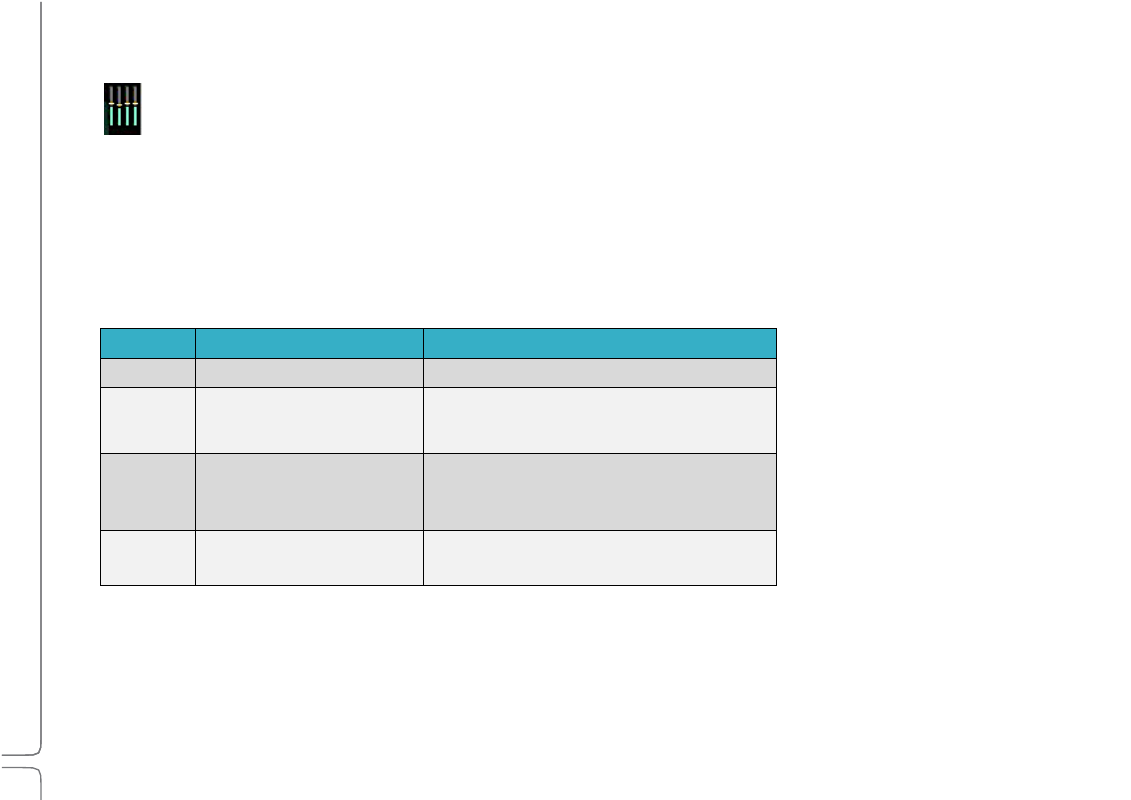
Meters
The meter bars on a server icon indicate DSP usage of each of the server’s cores. There is one meter per core.
The solid bar areas display
average
DSP use per core:
The yellow lines show
peak
use, as indicated in the percentage display above the line. Certain plugins can exhibit a high
average/peak DSP ratio. This may cause overloads (momentary or constant) that result in audio drops. When adding a large number
of these CPU-hungry plugins, the peak and average indicators will drift apart. In such cases, you may need to disable or remove
certain plugins.
Average Peak
Status
Green
DSP peak value: 1% to 84%
System is stable. You can add more plugins.
Yellow
DSP peak value: 1% to 84%
The network is approaching its limit. Monitor the
meter status and be prepared to remove some
plugins and/or increase the network buffer size.
Yellow
DSP peak value: 85% to 99%
Network load is excessive. Monitor the meter
status. Remove some plugins and/or increase the
network buffer size.
Red
DSP load is beyond the limit. Remove heavy-load
plugins immediately.