View the online status of the profibus network – ProSoft Technology PTQ-PDPMV1 User Manual
Page 230
Diagnostics and Troubleshooting
PTQ-PDPMV1 ♦ Quantum Platform
User Manual
PROFIBUS DP Master Network Interface Module for Quantum
Page 230 of 306
ProSoft Technology, Inc.
August 12, 2014
8.5
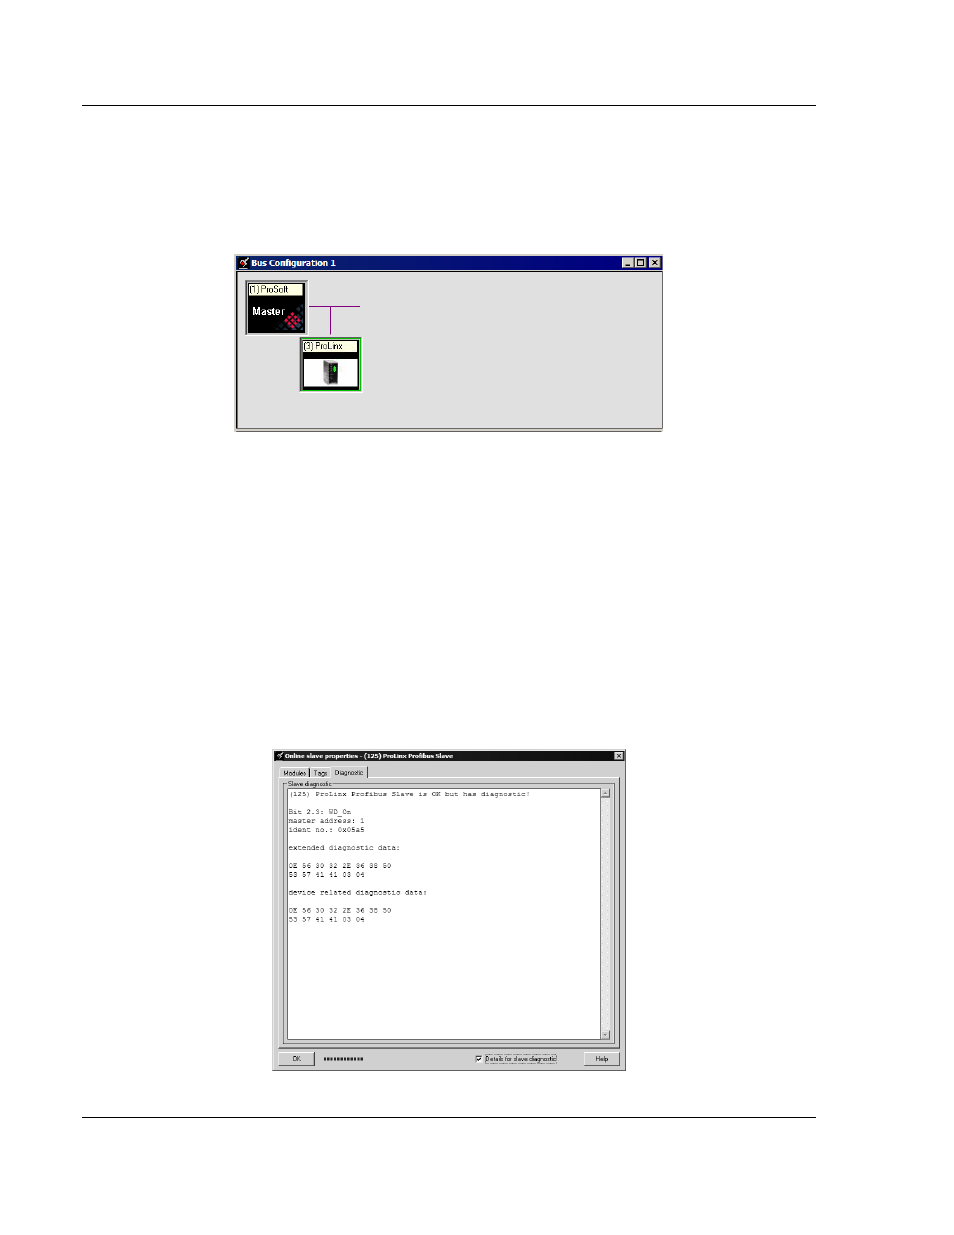
View the Online Status of the PROFIBUS Network
1 In ProSoft Configuration Builder for PROFIBUS, open the O
NLINE
menu, and
then choose M
ONITOR
/M
ODIFY
. ProSoft Configuration Builder will establish
communication with the PTQ-PDPMV1 module, and will indicate
communication status.
o
If the
SLAVE
icon in the Bus Configuration window has a green border,
then the PTQ-PDPMV1 module is correctly communicating with the
PROFIBUS slave.
o
If the
SLAVE
icon in the Bus Configuration window has a red border, then
the module is not communicating with the slave.
o
If the
SLAVE
icon in the Bus Configuration window has a blue border, the
slave is communicating with the Master, but is generating diagnostic data.
To view diagnostic data for the slave, select the
SLAVE
, and click the right
mouse button to open a shortcut menu. On the shortcut menu, choose
O
NLINE
P
ROPERTIES
.
2 In the Online Slave Properties dialog box, click the D
IAGNOSTIC
tab, and
select (check)
D
ETAILS
for slave diagnostic. Slave diagnostic information will
appear in the Diagnostic window. Refer to the documentation for your
PROFIBUS slave to determine the meaning of the diagnostic data.