Diagnostics, Debugging output – Yaskawa MotionWorks IEC Hardware User Manual
Page 111
MotionWorks IEC Hardware Configuration – 2013-03-26
108
Diagnostics
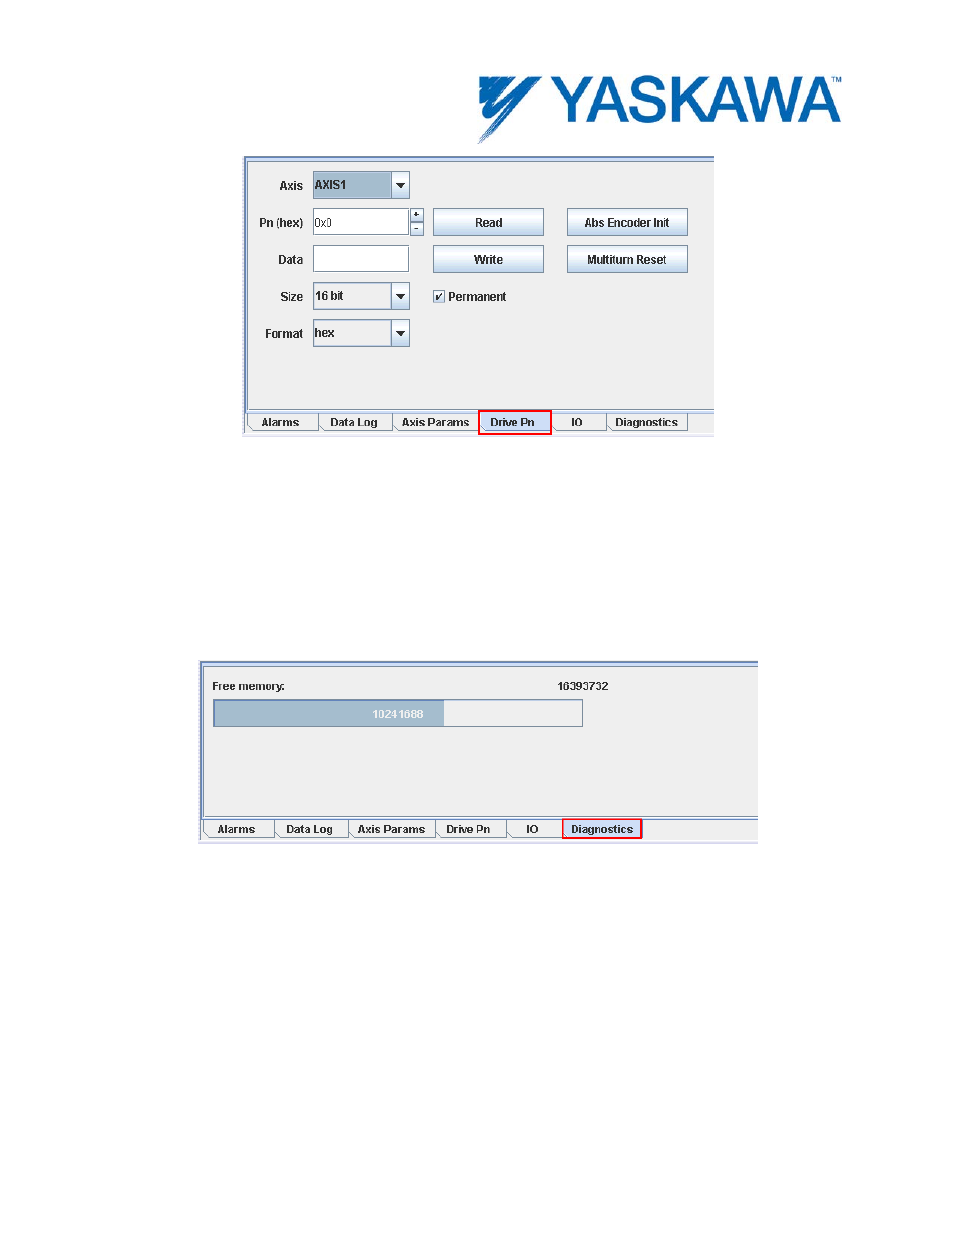
The Diagnostics tab shows the total free memory (1.6 MB in the figure
below) and the memory being used by the application project running on the
controller (1.02 MB in the example shown below)
Debugging Output
The debugging outputs page window shows a log of events encountered and
tasks performed during the latest power up of the controller. For example
the list of motion axes and I/O units that were discovered, the
communication drivers that were started, the configuration files read, etc.
are listed in this log.
See also other documents in the category Yaskawa Equipment:
- Tag Generator (30 pages)
- MP3300iec (82 pages)
- 1000 Hz High Frequency (18 pages)
- 1000 Series (7 pages)
- PS-A10LB (39 pages)
- iQpump Micro User Manual (300 pages)
- 1000 Series Drive Option - Digital Input (30 pages)
- 1000 Series Drive Option - CANopen (39 pages)
- 1000 Series Drive Option - Analog Monitor (27 pages)
- 1000 Series Drive Option - CANopen Technical Manual (37 pages)
- 1000 Series Drive Option - CC-Link (38 pages)
- 1000 Series Drive Option - CC-Link Technical Manual (36 pages)
- 1000 Series Drive Option - DeviceNet (37 pages)
- 1000 Series Drive Option - DeviceNet Technical Manual (81 pages)
- 1000 Series Drive Option - MECHATROLINK-II (32 pages)
- 1000 Series Drive Option - Digital Output (31 pages)
- 1000 Series Drive Option - MECHATROLINK-II Technical Manual (41 pages)
- 1000 Series Drive Option - Profibus-DP (35 pages)
- AC Drive 1000-Series Option PG-RT3 Motor (36 pages)
- Z1000U HVAC MATRIX Drive Quick Start (378 pages)
- 1000 Series Operator Mounting Kit NEMA Type 4X (20 pages)
- 1000 Series Drive Option - Profibus-DP Technical Manual (44 pages)
- CopyUnitManager (38 pages)
- 1000 Series Option - JVOP-182 Remote LED (58 pages)
- 1000 Series Option - PG-X3 Line Driver (31 pages)
- SI-EN3 Technical Manual (68 pages)
- JVOP-181 (22 pages)
- JVOP-181 USB Copy Unit (2 pages)
- SI-EN3 (54 pages)
- SI-ET3 (49 pages)
- MECHATROLINK-III (35 pages)
- EtherNet/IP (50 pages)
- SI-EM3 (51 pages)
- 1000-Series Option PG-E3 Motor Encoder Feedback (33 pages)
- 1000-Series Option SI-EP3 PROFINET (56 pages)
- PROFINET (62 pages)
- AC Drive 1000-Series Option PG-RT3 Motor (45 pages)
- SI-EP3 PROFINET Technical Manual (53 pages)
- A1000 Drive Option - BACnet MS/TP (48 pages)
- 120 Series I/O Modules (308 pages)
- A1000 12-Pulse (92 pages)
- A1000 Drive Software Technical Manual (16 pages)
- A1000 Quick Start (2 pages)
- JUNMA Series AC SERVOMOTOR (1 page)
- A1000 Option DI-101 120 Vac Digital Input Option (24 pages)