Map screen: flow delay, Grain harvest diagnostics, Rain – Ag Leader Versa Users Manual User Manual
Page 288: Arvest, Iagnostics, Creen, Elay
274
Firmware Version 5.4
M
AP
S
CREEN
: F
LOW
D
ELAY
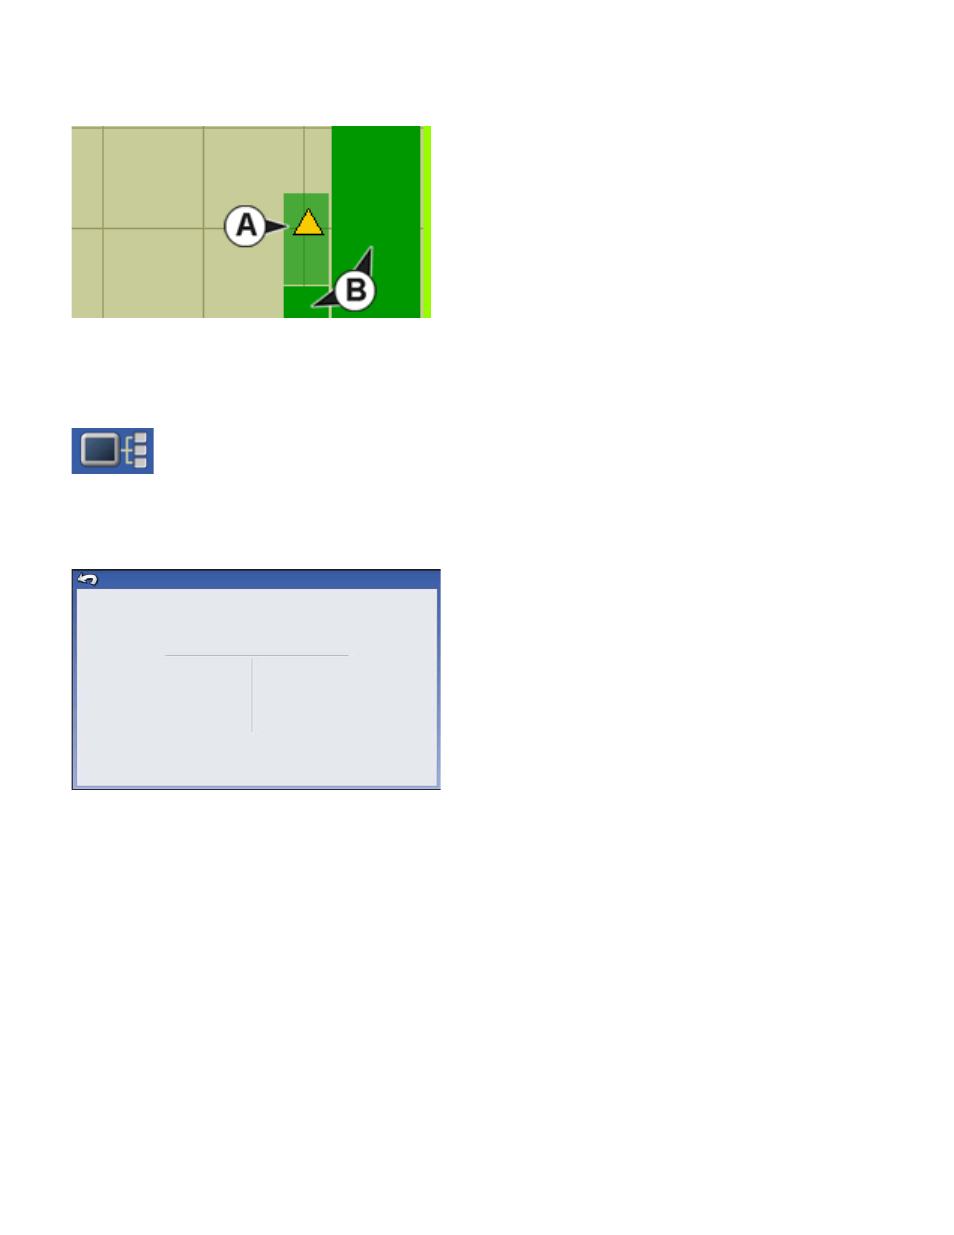
When the Map screen is running in a Zoom Detail
view, instantaneous coverage (A) is shown
automatically. However, there is a time lag between
when grain enters the combine through the Header
and is logged by the Flow Sensor in the Clean Grain
Elevator. Because of this time lag, the instantaneous
coverage is shown on the Map screen as a lighter
color than coverage that has been logged (B) by the
display.
G
RAIN
H
ARVEST
D
IAGNOSTICS
When performing a Harvest operation, you can also access the Harvest Diagnostic screen
by pressing the Display Information button. Technical support may request that you look at
this screen for help in diagnosing a problem. When the Devices screen opens, press and
highlight the Moisture Module listing in the CAN Device list, then press the Diagnostics button. The Grain
Harvest Diagnostics screen appears.
The Grain Harvest Diagnostics screen includes the
following information:
• Flow Rate
Grain flow rate, shown in kilograms per second.
• Flow Max, Flow Min and Flow Offset
Raw flow values used for diagnostic purposes.
• Sensor Force
Force of grain flow, shown in Newtons.
• Header Raw
Raw value of header sensor.
• Speed Pulses
Shows the number of ground speed pulses from the combine.
• Moisture Raw
Raw value of moisture sensor.
• Temperature
Air temperature, shown in Celsius.
• Temperature Raw
Raw value of temperature sensor.
• Proximity Sensor
Shows if Elevator Mount Unit sensor is covered with grain.
• Relay Status
Shows on or off.
Grain Harvest Diagnostics
Region Distance
18257 ft
Flow Rate
5.12
Flow Max
216
Flow Mn
172
Flow Offset
350
Sensor Force
9.95
Header Raw
296
Speed Pulse
103
Moisture Raw
3.21
Temperature
-3.8
Temperature Raw
2.69
Proximity Status
ON
Relay Status
ON
Motor Current
0.9