Summary – HP 3PAR Operating System Software User Manual
Page 370
Medium – Provides a medium level of detail (for example, 1, 4, 16, 64 IO/(GiB*min), and
so on).
Coarse – Provides a compact level of detail (for example, 1, 8, 64, 512 IO/(GiB*min), and
so on).
5.
In the Time Interval group box, select a Start Time and End Time. If you keep the default end
time as the current date and time, you can select the start time to be a specific number of
hours prior to the end time. You also have the option to select a specific date and time for
both the start and end times, see
“Time Interval Group Box” (page 445)
.
6.
In the Show Charts group box, select a checkbox to show the following types of charts:
Cumulative or Percentage.
7.
Select the Show data for each VV checkbox if you want to filter the Virtual Volumes.
8.
Click Next.
Summary
Review your settings, then click Finish to complete the wizard.
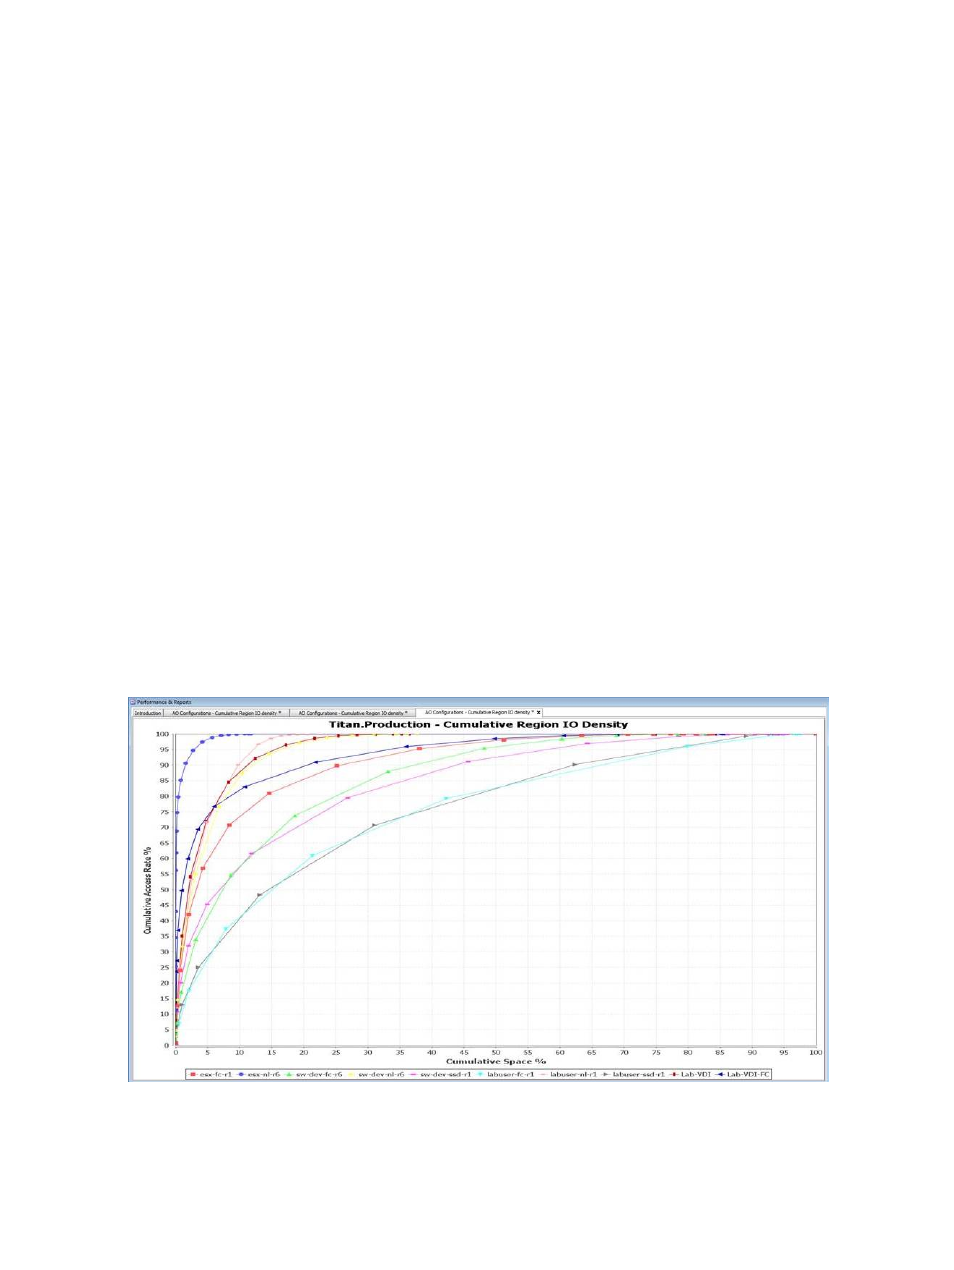
Creating an AO Configurations Cumulative Region IO Density Report
The AO Cumulative Region IO Density report displays the I/O cumulative access rates vs. space
rate and distribution of data for each tier and how AO has moved regions between tiers.
The report displays cumulative IO Rate Density data on the Y-axis and Cumulative Space for the
specified AO on the X-axis. The chart can be plotted by selecting different options such as, Chart
Details (as Fine, medium, Coarse), or the Filter on the selected AO, or Display Metric of Number
of Percentage on the Object selection page.
If Display metric is Number and the X-axis (category) displays the Cumulative Space and the Y-axis
is the Cumulative Access Rate The CPG per tier legends are displayed at bottom of the chart.
The following charts show are shown with and without the Percentage option selected (in Objection
Selection).
370 Tracking Performance