HP Prime Graphing Calculator User Manual
Page 350
346
Functions and commands
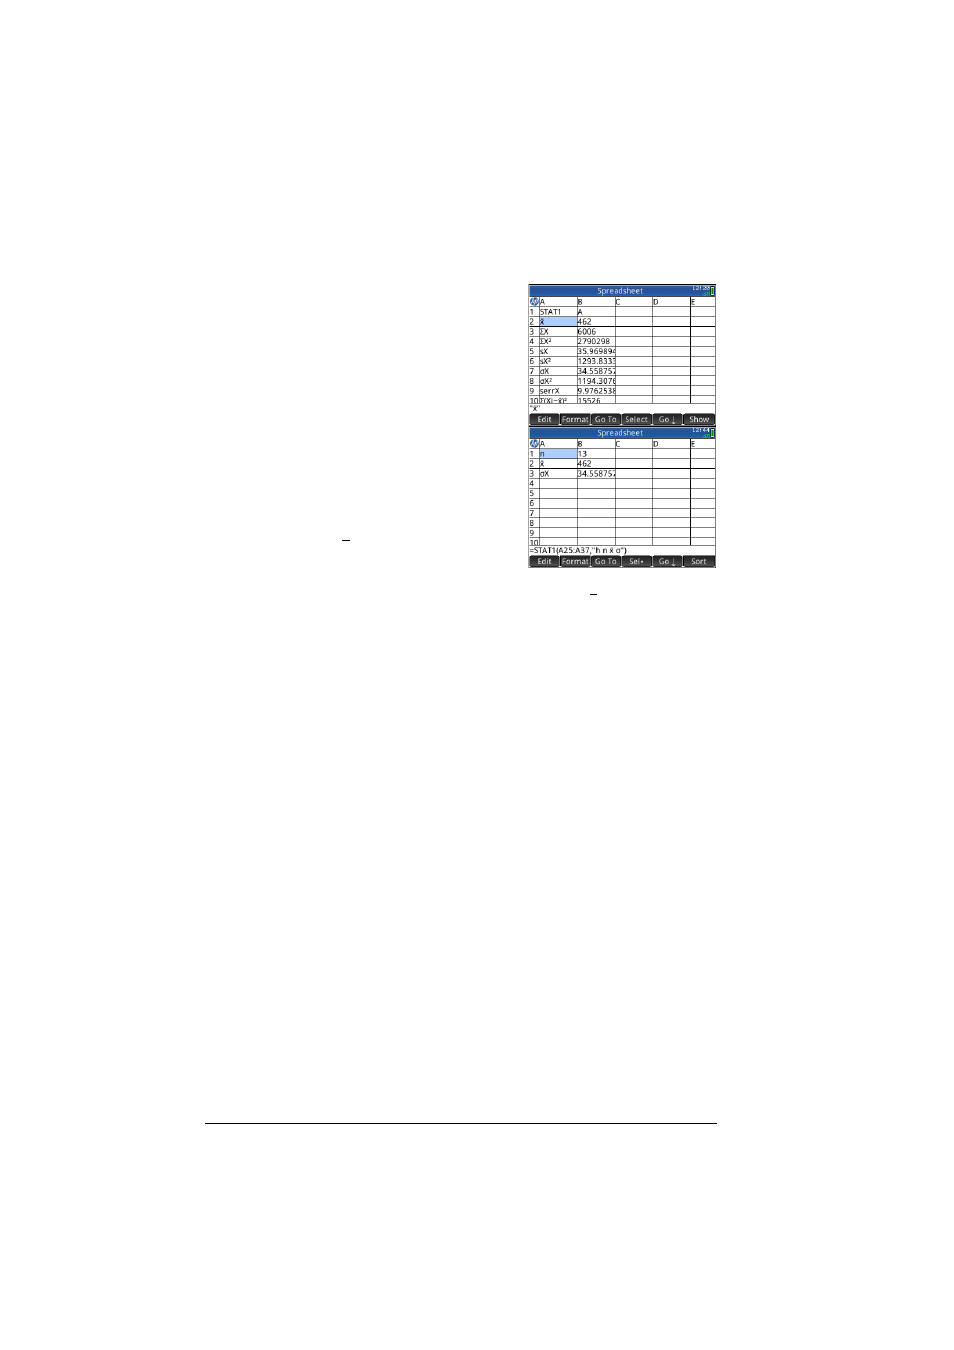
For example:
=STAT1(A25:A37)
produces the following
default output.
However, if you just wanted
to see the number of data-
points, the mean, and the
standard deviation, you
would enter
=STAT1(A25:A37,”h n
x ”). What the
configuration string is
indicating here is that row headings are required (h), and just
the number of data-points (n), the mean (x), and the standard
deviation ().
SUM
Calculates the sum of a range of numbers.
SUM([input])
For example, SUM)B7:B23) returns the sum of the numbers
in the range B7 to B23. You can also specify a block of cells,
as in SUM(B7:C23).
An error is returned if a cell in the specified range contains a
non-numeric object.
AVERAGE
Calculates the arithmetic mean of a range of numbers.
AVERAGE([input])
For example, AVERAGE(B7:B23) returns the arithmetic
mean of the numbers in the range B7 to B23. You can also
specify a block of cells, as in AVERAG(B7:C23).
An error is returned if a cell in the specified range contains a
non-numeric object.
- iPAQ Glisten (185 pages)
- iPAQ Glisten-AT&T (185 pages)
- iPAQ rx5900 Travel Companion (10 pages)
- iPAQ h1900 Pocket PC series (127 pages)
- iPAQ hx2700 Pocket PC series (168 pages)
- QuickSpecs H5400 (13 pages)
- 620LX (172 pages)
- IPAQ H1930 (13 pages)
- 700 Series (204 pages)
- iPAQ h5150 (8 pages)
- Jornada 420 (146 pages)
- iPAQ PC h1910 (2 pages)
- HX2000 (11 pages)
- iPAQ hx2000 Series (3 pages)
- h4000 (141 pages)
- iPAQ HX2495b (10 pages)
- 820e (178 pages)
- 820 (186 pages)
- iPAQ h1910 (105 pages)
- iPAQ hx2790c (10 pages)
- IPAQ Pocket PC hx2110 (7 pages)
- rx3000 Series (301 pages)
- iPAQ hx4700 (169 pages)
- 2490 (14 pages)
- iPAQ hw6500 (170 pages)
- h6300 (190 pages)
- IPAQ HX2750 (9 pages)
- iPAQ h2200 Pocket PC series (125 pages)
- iPAQ Pocket PC h5400 Series (10 pages)
- Jornada 520 (134 pages)
- iPAQ h4100 Pocket PC series (143 pages)
- IPAQ H5100 (169 pages)
- h5400 (273 pages)
- IPAQ RX3000 (60 pages)
- H2200 (9 pages)
- UNIX AA-XXXXX-TF (15 pages)
- Jornada 540 Series (135 pages)
- PC Series (22 pages)
- 430se (151 pages)
- h1937 EN (127 pages)
- PrintCalc 100 (33 pages)
- PrintCalc 100 (32 pages)
- 48gII Graphing Calculator (864 pages)
- 48gII Graphing Calculator (892 pages)
- EliteBook 2740p Tablet-PC (179 pages)