Trace a graph, Change the scale – HP Prime Graphing Calculator User Manual
Page 118
114
Function app
Trace a
graph
By default, the trace functionality is active. This enables
you to move a cursor along a graph. If more than two
graphs are shown, the graph that is the highest in the list
of functions in Symbolic view is the graph that will be
traced by default. Since the linear equation is higher than
the quadratic function in Symbolic view, it is the graph on
which the tracing cursor appears by default.
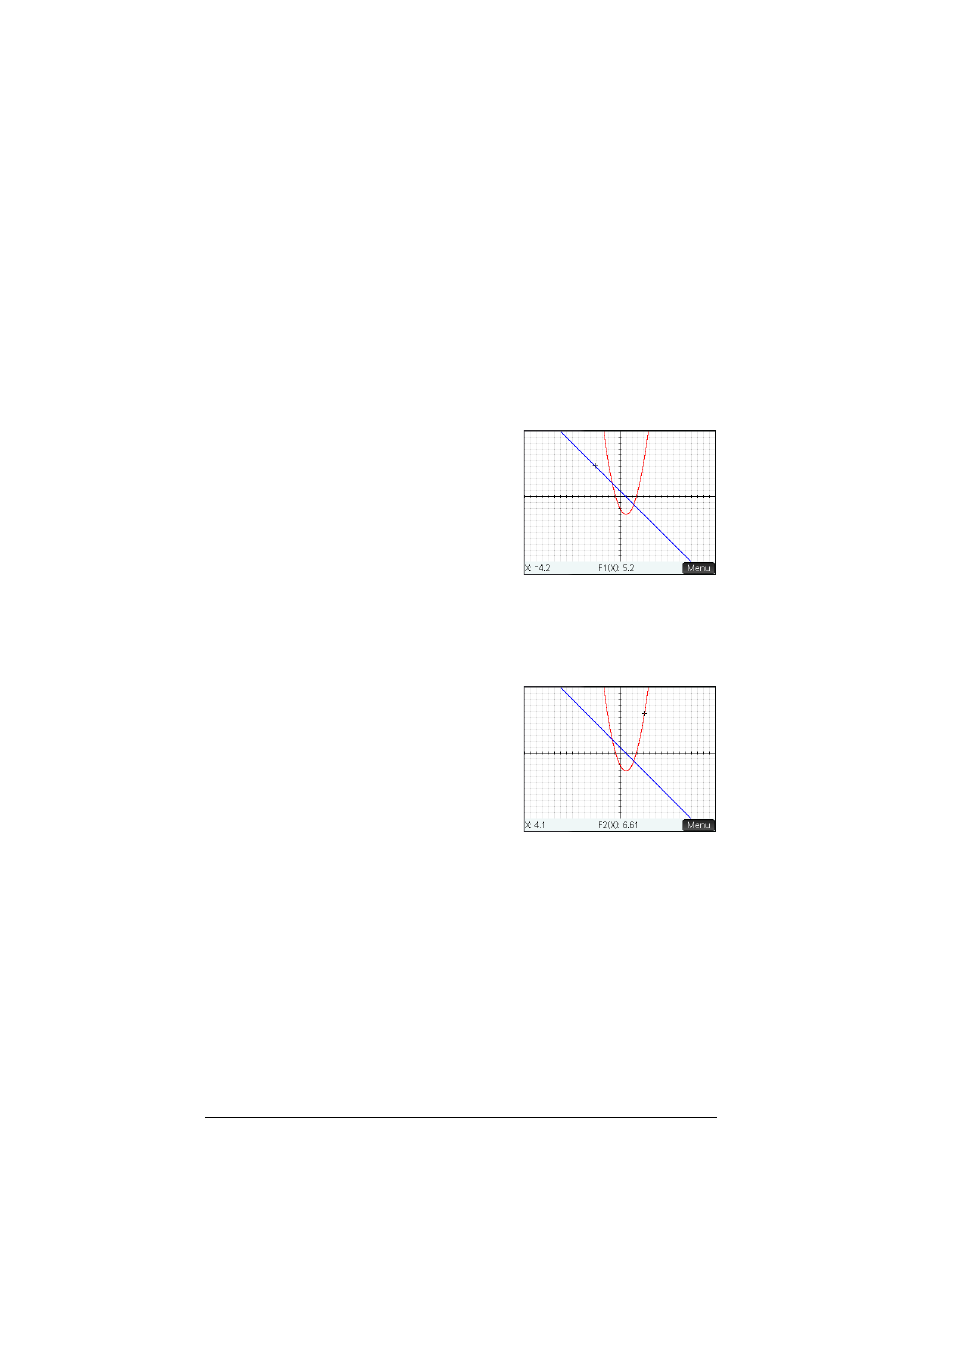
8. Trace the linear
function.
>
or
<
Note how a cursor
moves along the
plot as you press
the buttons. Note
too that the
coordinates of the cursor appear at the bottom of the
screen and change as you move the cursor.
9. Move the tracing cursor from the linear function to the
quadratic function.
=
or
\
10. Trace the quadratic
function.
>
or
<
Again notice how
the coordinates of
the cursor appear at
the bottom of the
screen and change as you move the cursor.
Tracing is explained in more detail in “Trace” on
page 94.
Change the
scale
You can change the scale to see more or less of your
graph. This can be done in four ways:
•
Press
+
to zoom in or
w
to zoom out on the
current cursor position. This method uses the zoom
factors set in the Zoom menu. The default for both x
and y is 2.
•
Use the Plot Setup view to specify the exact x-range
(XRNG) and y-range (YRNG) you want.