HP Prime Graphing Calculator User Manual
Page 237
Statistics 2Var app
233
necessary), the
X Rng
and
Y Rng
fields in Plot Setup
view. (
SP
).
3. Press
P
.
If the data set and regression line are not ideally
positioned, Press
V
and select Autoscale.
Autoscale can be relied upon to give a good starting
scale which can then be adjusted later in the Plot
Setup view.
Tracing a scatter
plot
The figures below the plot
indicate that the cursor is
at the second data point of
S1, at ((1, 920). Press
>
to
move to the next data
point and display
information about it.
Tracing a curve
If the regression line is not showing, tap
. The
coordinates of the tracer cursor are shown at the bottom
of the screen. (If they are not visible, tap
.)
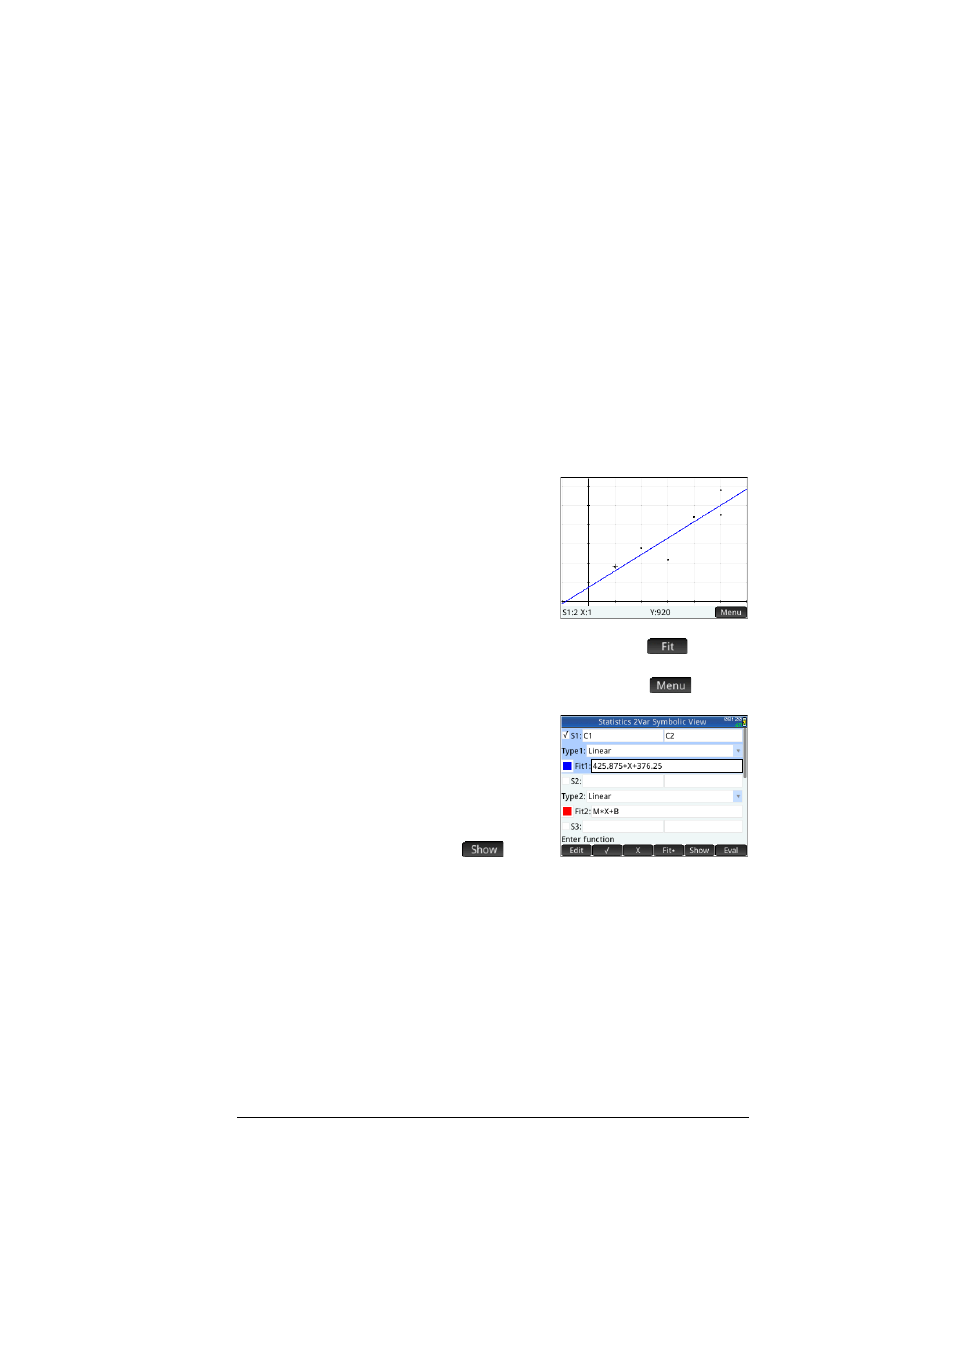
Press
Y
to see the
equation of the
regression line in
Symbolic view.
If the equation is too wide
for the screen, select it
and press
.
The example above shows that the slope of the regression
line (m) is 425.875 and the y-intercept (b) is 376.25.
Tracing order
While
>
and
<
move the cursor along a fit or from
point to point in a scatter plot, use
=
and
\
to choose
the scatter plot or fit you wish to trace. For each active
analysis (S1–S5), the tracing order is the scatter plot first
and the fit second. So if both S1 and S2 are active, the
tracer is by default on the S1 scatter plot when you press
P
. Press
\
to trace the S1 fit. At this point, press
=
to return to the S1 scatter plot or
\
again to trace the S2
scatter plot. Press
\
a third time to trace the S2 fit. If you