Plot the expression, Explore the graph – HP Prime Graphing Calculator User Manual
Page 281
Polar app
277
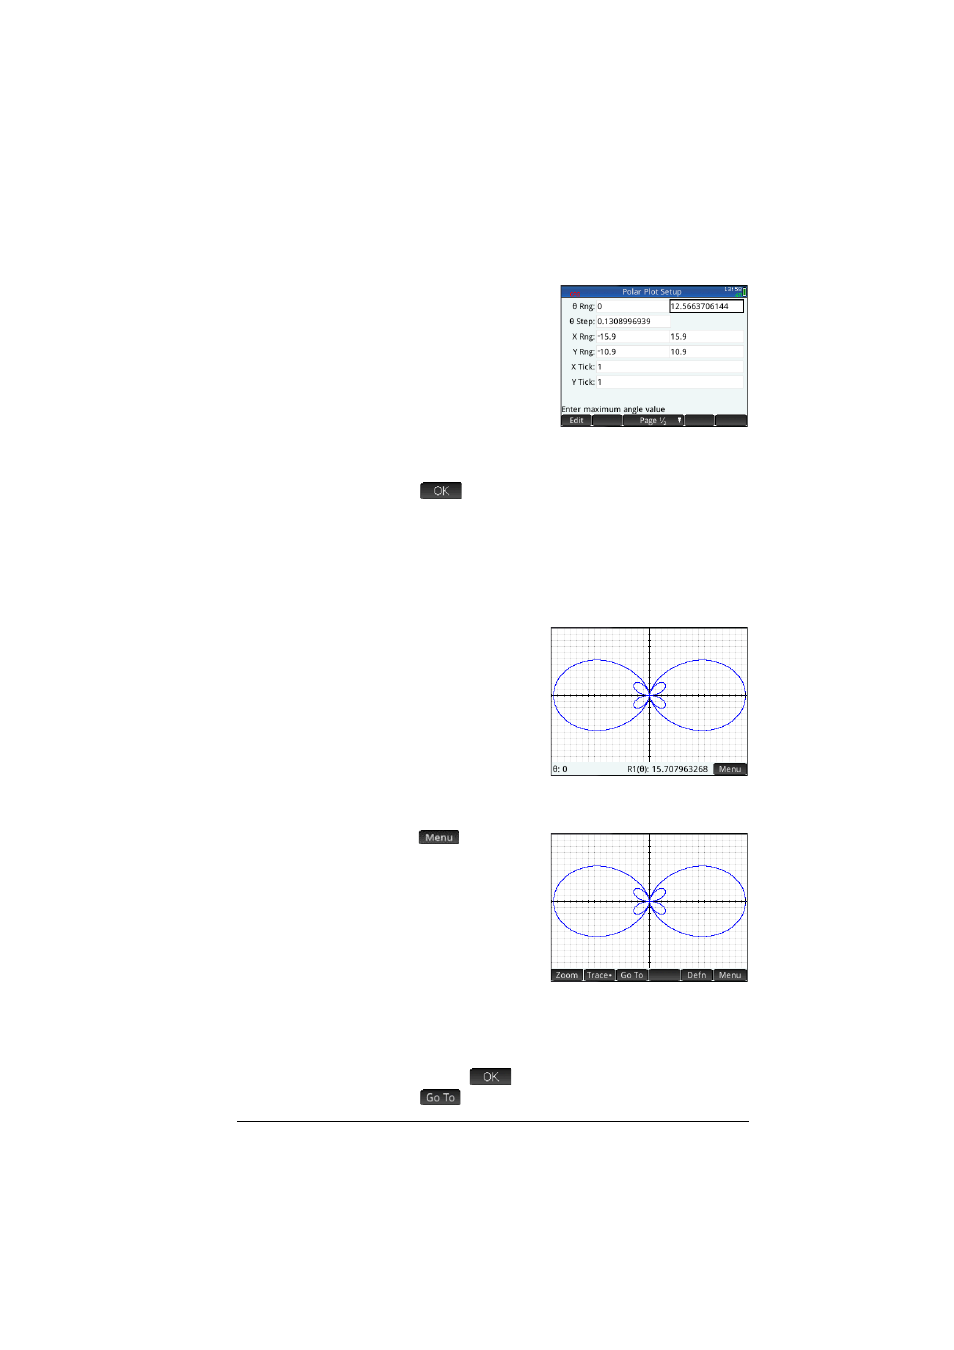
8. Set up the plot by
specifying
appropriate
graphing options. In
this example, set the
upper limit of the
range of the
independent
variable to 4:
Select the 2nd Rng field and enter 4
Sz
(
There are numerous ways of configuring the
appearance of Plot view. For more information, see
“Common operations in Plot Setup view” on
page 96.
Plot the
expression
9. Plot the expression:
P
Explore the
graph
10. Display the Plot view menu.
A number of
options appear to
help you can
explore the graph,
such as zoom and
trace options. using
the trace and zoom
options. You can also jump directly to a particular
value by entering that value. The Go To screen
appears with the number you typed on the entry line.
Just tap
to accept it. (You could also tap the
button and spwecify the target value.)
- iPAQ Glisten (185 pages)
- iPAQ Glisten-AT&T (185 pages)
- iPAQ rx5900 Travel Companion (10 pages)
- iPAQ h1900 Pocket PC series (127 pages)
- iPAQ hx2700 Pocket PC series (168 pages)
- QuickSpecs H5400 (13 pages)
- 620LX (172 pages)
- IPAQ H1930 (13 pages)
- 700 Series (204 pages)
- iPAQ h5150 (8 pages)
- Jornada 420 (146 pages)
- iPAQ PC h1910 (2 pages)
- HX2000 (11 pages)
- iPAQ hx2000 Series (3 pages)
- h4000 (141 pages)
- iPAQ HX2495b (10 pages)
- 820e (178 pages)
- 820 (186 pages)
- iPAQ h1910 (105 pages)
- iPAQ hx2790c (10 pages)
- IPAQ Pocket PC hx2110 (7 pages)
- rx3000 Series (301 pages)
- iPAQ hx4700 (169 pages)
- 2490 (14 pages)
- iPAQ hw6500 (170 pages)
- h6300 (190 pages)
- IPAQ HX2750 (9 pages)
- iPAQ h2200 Pocket PC series (125 pages)
- iPAQ Pocket PC h5400 Series (10 pages)
- Jornada 520 (134 pages)
- iPAQ h4100 Pocket PC series (143 pages)
- IPAQ H5100 (169 pages)
- h5400 (273 pages)
- IPAQ RX3000 (60 pages)
- H2200 (9 pages)
- UNIX AA-XXXXX-TF (15 pages)
- Jornada 540 Series (135 pages)
- PC Series (22 pages)
- 430se (151 pages)
- h1937 EN (127 pages)
- PrintCalc 100 (33 pages)
- PrintCalc 100 (32 pages)
- 48gII Graphing Calculator (864 pages)
- 48gII Graphing Calculator (892 pages)
- EliteBook 2740p Tablet-PC (179 pages)