Setup plot, Plot the graph – HP Prime Graphing Calculator User Manual
Page 228
224
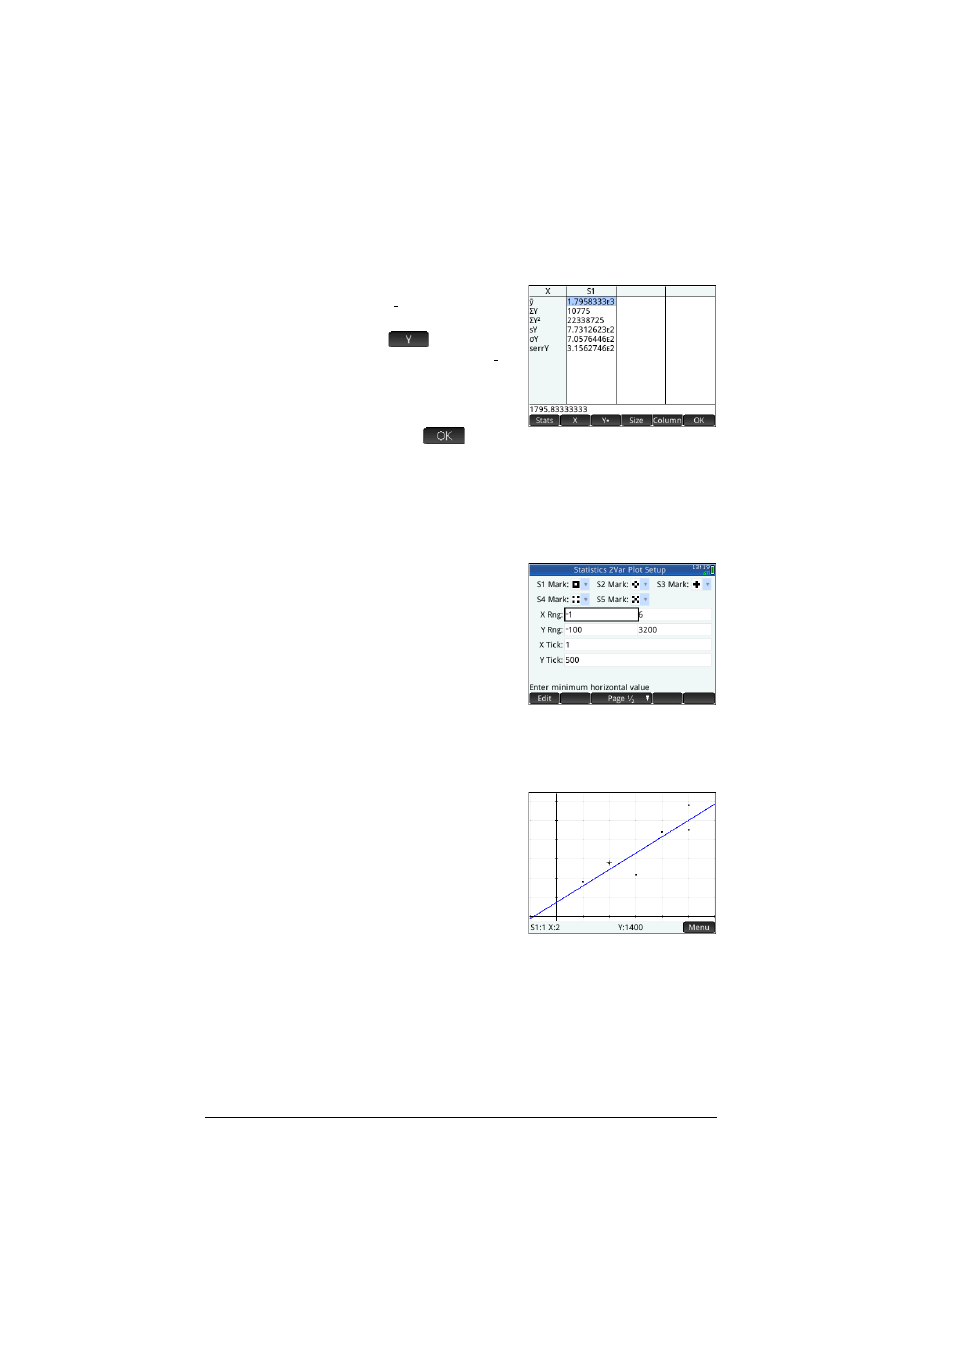
Statistics 2Var app
10. Find the mean sales
( ).
The mean sales, ,
is approximately
$1,796.
Press
to
return to Numeric view.
Setup plot
11. Change the plotting range to ensure that all the data
points are plotted (and to select a different data-point
indicator, if you wish).
SP
(Setup)
Q
1
E
6
E Q
100
0
E
3200
E \
500
E
Plot the graph
12. Plot the graph.
P
Notice that the
regression curve (that
is, a curve to best fit
the data points) is
plotted by default.
y
y
See also other documents in the category HP Tablet:
- iPAQ Glisten (185 pages)
- iPAQ Glisten-AT&T (185 pages)
- iPAQ rx5900 Travel Companion (10 pages)
- iPAQ h1900 Pocket PC series (127 pages)
- iPAQ hx2700 Pocket PC series (168 pages)
- QuickSpecs H5400 (13 pages)
- 620LX (172 pages)
- IPAQ H1930 (13 pages)
- 700 Series (204 pages)
- iPAQ h5150 (8 pages)
- Jornada 420 (146 pages)
- iPAQ PC h1910 (2 pages)
- HX2000 (11 pages)
- iPAQ hx2000 Series (3 pages)
- h4000 (141 pages)
- iPAQ HX2495b (10 pages)
- 820e (178 pages)
- 820 (186 pages)
- iPAQ h1910 (105 pages)
- iPAQ hx2790c (10 pages)
- IPAQ Pocket PC hx2110 (7 pages)
- rx3000 Series (301 pages)
- iPAQ hx4700 (169 pages)
- 2490 (14 pages)
- iPAQ hw6500 (170 pages)
- h6300 (190 pages)
- IPAQ HX2750 (9 pages)
- iPAQ h2200 Pocket PC series (125 pages)
- iPAQ Pocket PC h5400 Series (10 pages)
- Jornada 520 (134 pages)
- iPAQ h4100 Pocket PC series (143 pages)
- IPAQ H5100 (169 pages)
- h5400 (273 pages)
- IPAQ RX3000 (60 pages)
- H2200 (9 pages)
- UNIX AA-XXXXX-TF (15 pages)
- Jornada 540 Series (135 pages)
- PC Series (22 pages)
- 430se (151 pages)
- h1937 EN (127 pages)
- PrintCalc 100 (33 pages)
- PrintCalc 100 (32 pages)
- 48gII Graphing Calculator (864 pages)
- 48gII Graphing Calculator (892 pages)
- EliteBook 2740p Tablet-PC (179 pages)