HP Prime Graphing Calculator User Manual
Page 140
136
Geometry
Preparation
1. Press
SH
.
2. On the
Home Setting
screen set the number format to
Fixed and the number of decimal places to 3.
Open the app
and plot the
graph
3. Press
I
and select
Geometry
.
If there are objects showing that you don’t need, press
SJ
and confirm your intention by tapping
.
4. Select the type of graph you want to plot. In this example
we are plotting a simple sinusoidal function, so choose:
> Plot > Function
5. With plotfunc( on the entry line, enter 3*sin(x):
3
seASsE
Note that x must be entered in lowercase in the
Geometry app.
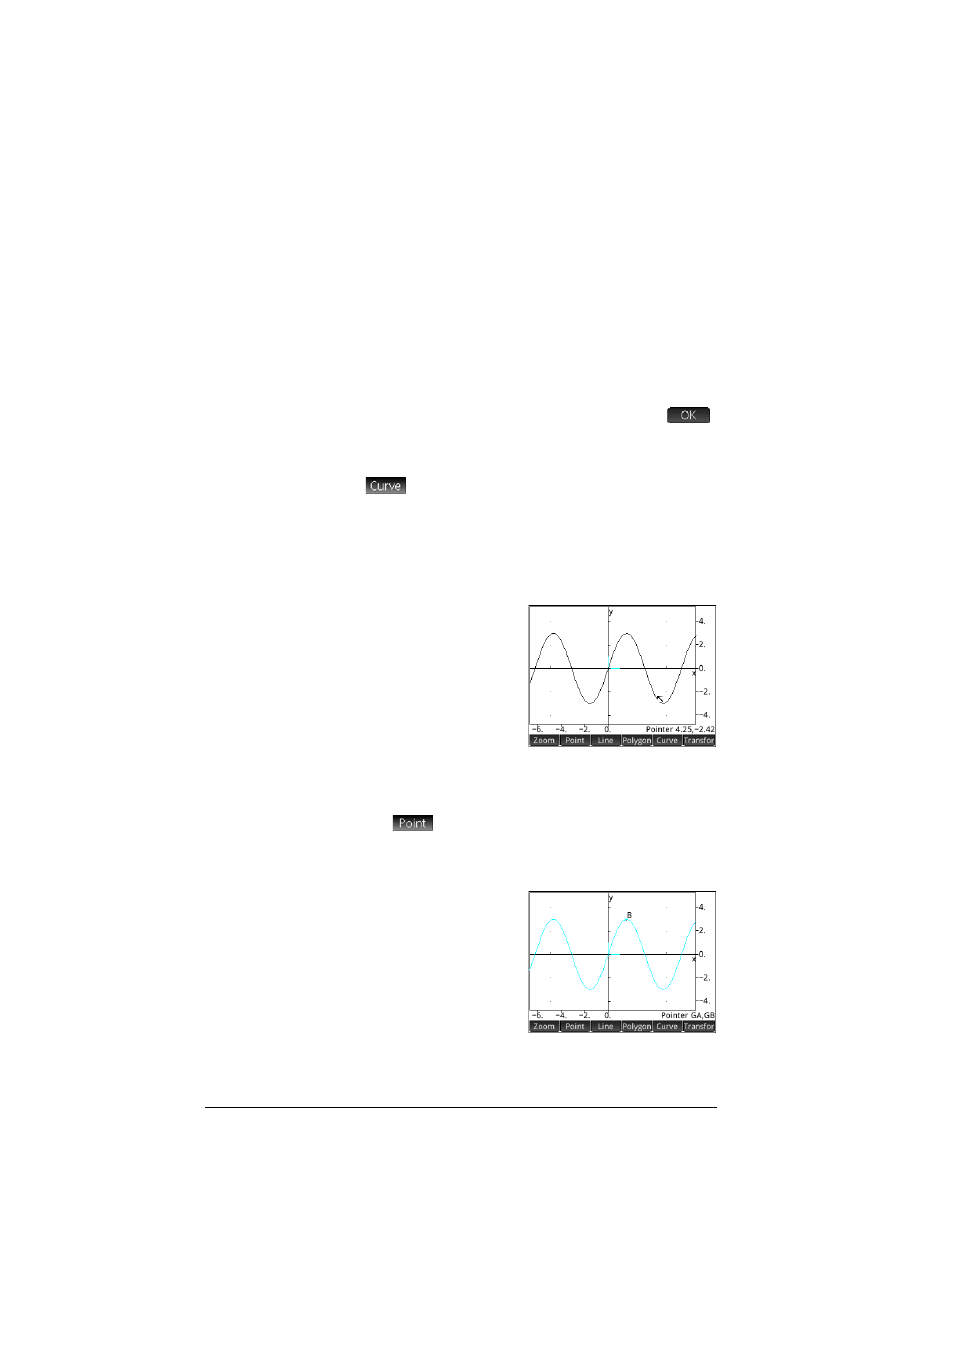
If your graph doesn’t
resemble the illustration
at the right, adjust the
X
Rng
and
Y
Rng
values
in Plot Setup view
(
SP
).
We’ll now add a point
to the curve, a point that
will be constrained always to follow the contour of the
curve.
Add a
constrained
point
6. Tap
and select Point On.
Choosing Point On rather than Point means that the
point will be constrained to whatever it is placed on.
7. Tap anywhere on the
graph, press
E
and then press
J
.
Notice that a point is
added to the graph and
given a name (B in this
example). Tap a blank
area of the screen to
deselect everything. (Objects colored cyan are selected.)