HP Prime Graphing Calculator User Manual
Page 137
Advanced Graphing app
133
Trace Edge
16.Tap
and
select
Edge.
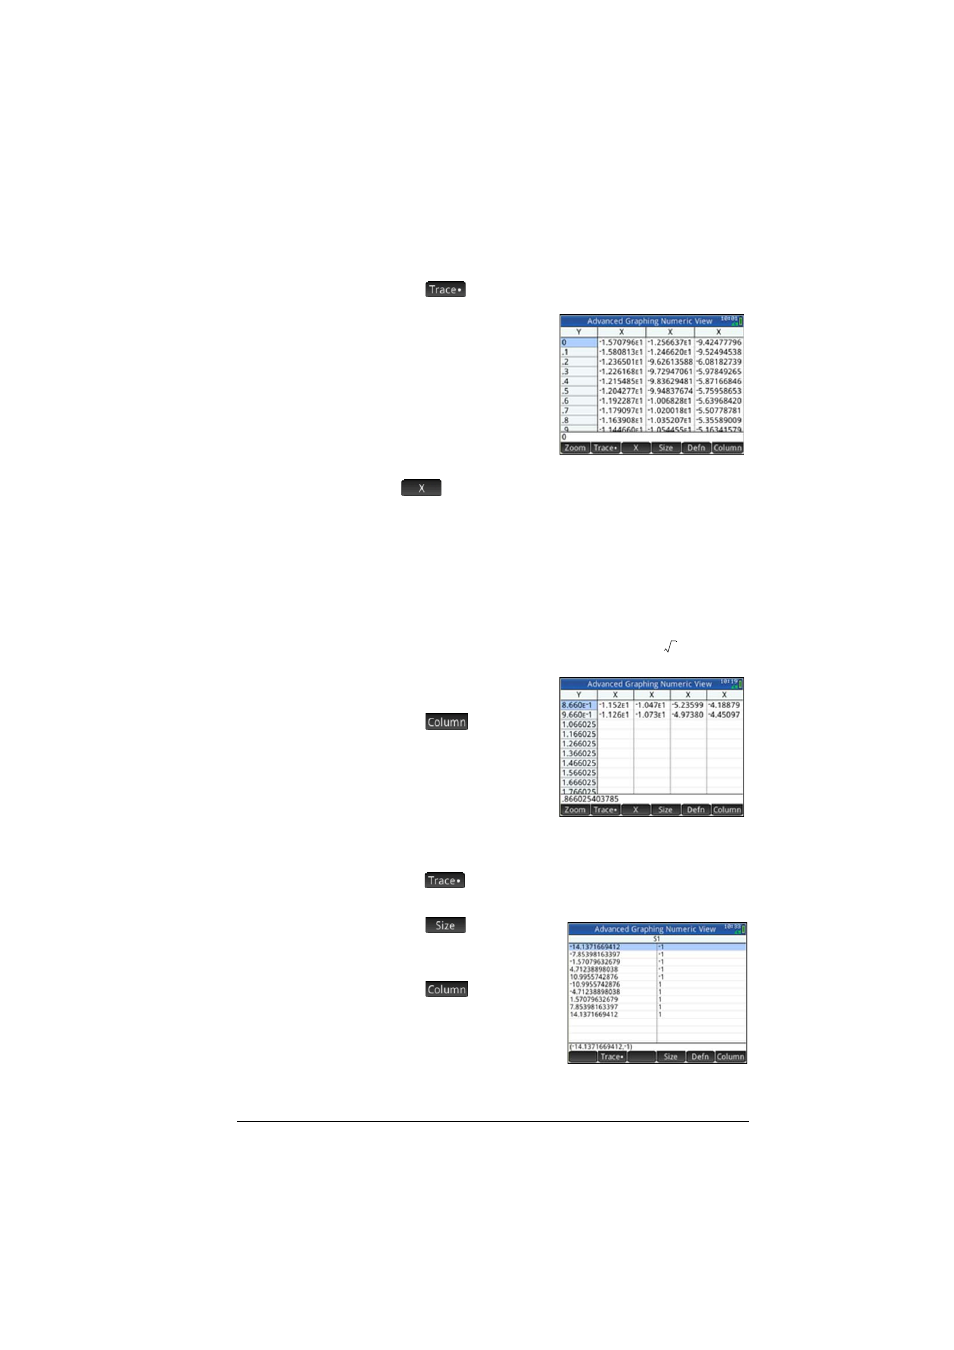
Now the table shows (if
possible) pairs of values
that make the relation true.
By default, the first column is
the Y-column and there are
multiple X-columns in case
more than one X-value can
be paired with the Y-value
to make the relation true.
Tap
to make the first column an X-column followed by
a set of Y-columns. In the figure above, for Y=0, there are 10
values of X in the default Plot view that make the relation
Y=SIN(X) true. These are shown in the first row of the table.
It can be clearly seen that the sequence of X-values have a
common difference of .
Again, you can enter a value for Y that is of interest.
17.With 0 highlighted in the Y-column, enter :
Sj
3
n
2
E
18.Tap
and
select
4.
The first row of the table
now illustrates that there are
two branches of solutions.
In each branch, the
consecutive solution values are 2 apart.
Trace PoI
19.Tap ,
select
PoI and select Vertical Extrema
to see the extrema listed in the table.
20.Tap
and
select
Small for a small font
size.
21.Tap
and
select
2
to see just two columns.
The table lists the 5 minima
visible in Plot view, followed
by the 5 maxima.
3
2
-------