Predicting values – HP Prime Graphing Calculator User Manual
Page 239
Statistics 2Var app
235
Predicting values
PredX is a function that predicts a value for X given a
value for Y. Likewise, PredY is a function that predicts a
value for Y given a value for X. In both cases, the
prediction is based on the equation that best fits the data
according to the specified fit type.
You can predict values in the Plot view of the Statistics
2Var app and also in Home view.
In Plot view
1. In the Plot view, tap
to display the regression
curve for the data set (if it is not already displayed).
2. Make sure the trace cursor is on the regression curve.
(Press
=
or
\
if it is not.)
3. Press
>
or
<
. The cursor moves along the
regression curve and the corresponding X and Y
values are displayed across the bottom of the screen.
(If these values are not visible, tap
.)
You can force the cursor to a specific X value by tapping
, entering the value and tapping
. The cursor
jumps to the specified point on the curve.
In Home
view
If the Statistics 2Var app is the active app, you can also
predict X and Y values in the Home view.
•
Enter PredX(Y)
E
to predict the X value for the
specified Y value.
•
Enter PredY(X)
E
to predict the Y value for the
specified X value.
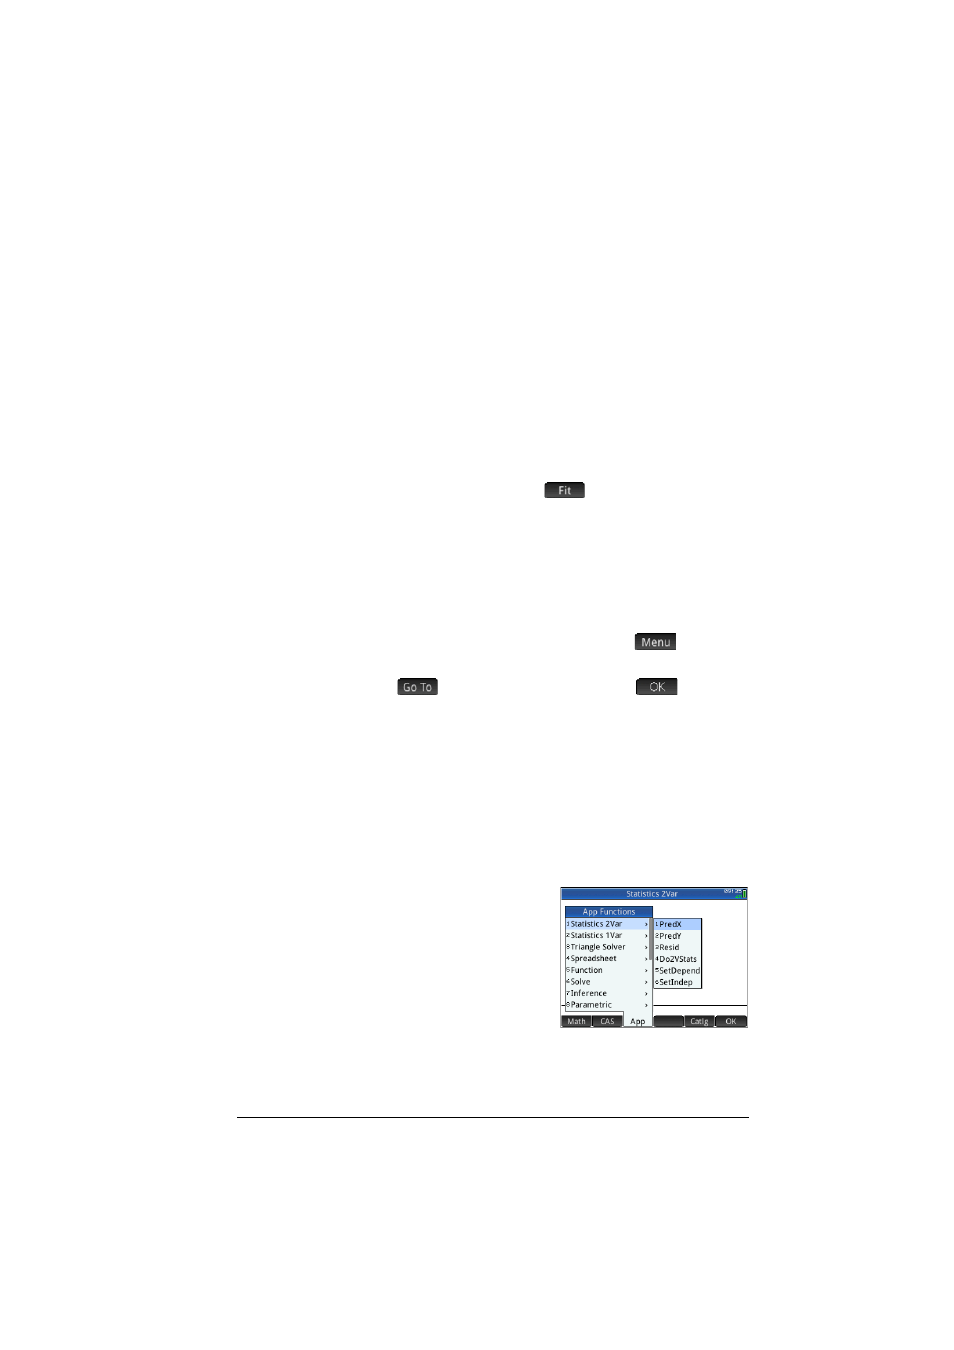
You can type PredX and
PredY directly on the
entry line, or select them
from the App functions
menu (under the
Statistics 2Var
category). The App
functions menu is one of
the Toolbox menus (
D
).