Plot view: menu items, Plot setup – HP Prime Graphing Calculator User Manual
Page 238
234
Statistics 2Var app
press
\
a fourth time, you will return to the S1 scatter
plot. If you are confused as to what you are tracing, just
tap
to see the definition of the object (scatter plot
or fit) currently being traced.
Plot view: menu items
The menu items in Plot view are:
Plot setup
As with all the apps that provide a plotting feature, he Plot
Setup view—
SP
(Setup)—enables you to set the
range and appearance of Plot view. The common settings
available are discussed in “Common operations in Plot
Setup view” on page 96. The Plot Setup view in the
Statistics 2Var app has two additional settings:
Plotting mark
Page 1 of the Plot Setup view has fields namedS1MARK
through S5MARK. These fields enable you to specify one
of five symbols to use to represent the data points in each
data set. This will help you distinguish data sets in Plot
view if you have chosen to plot more than one.
Connect
Page 2 of the Plot Setup view has a
Connect
field. If you
choose this option, straight lines join the data points in Plot
view.
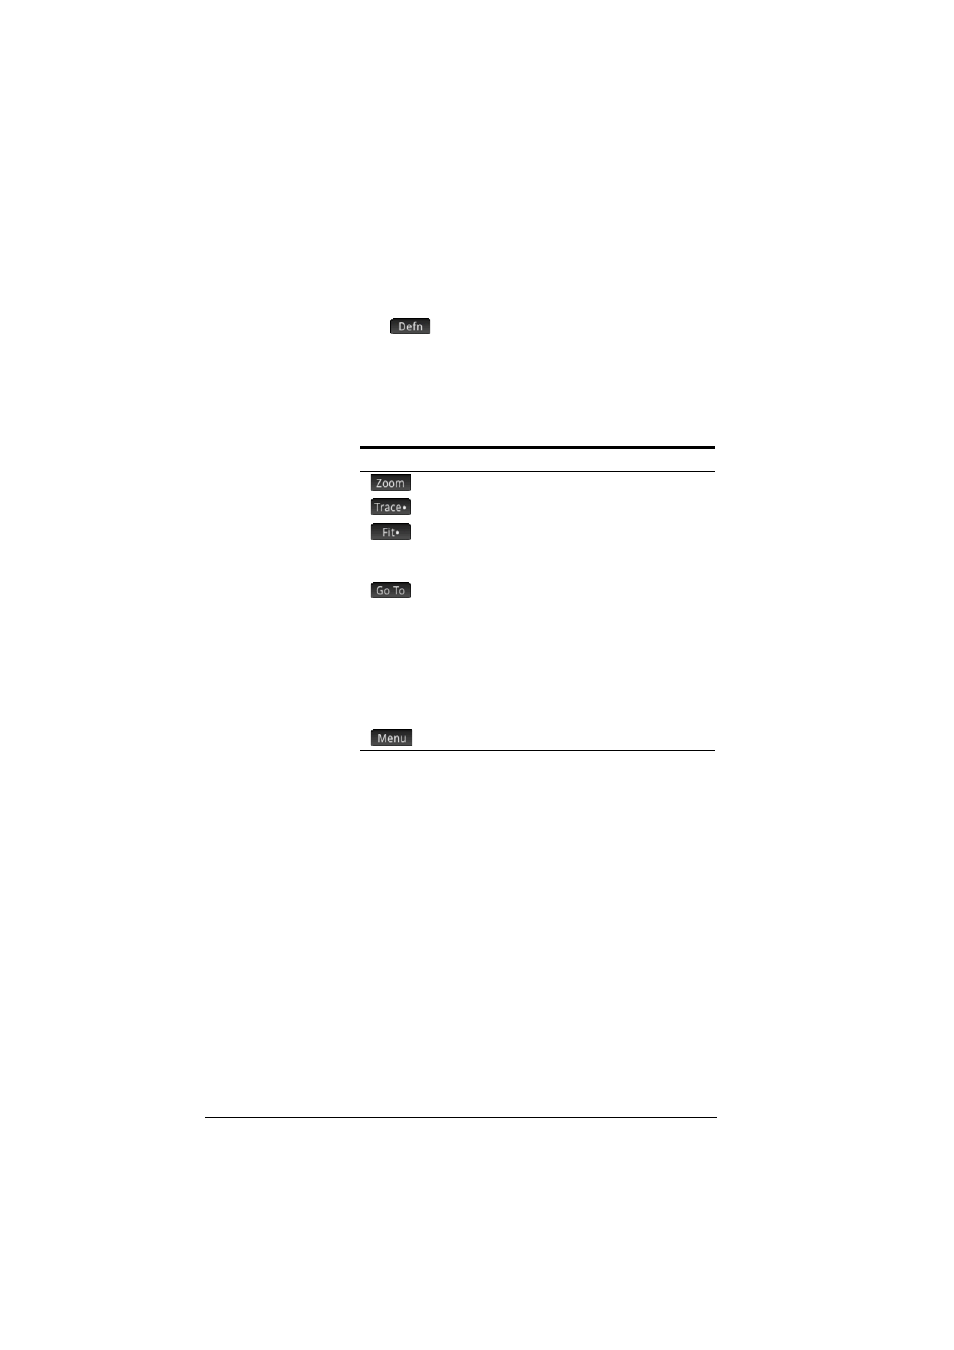
Button
Purpose
Displays the Zoom menu.
Turns trace mode on or off.
Shows or hides a curve that best fits
the data points according to the
selected regression model.
Enables you to specify a value on the
regression line to jump to (or a data
point to jump to if your cursor is on a
data point rather than on the
regression line). You might need to
press
=
or
\
to move the cursor to
the object of interest: the regression
line or the data points.
Shows or hides the menu buttons.