Setting up the plot (plot setup view), Exploring the graph – HP Prime Graphing Calculator User Manual
Page 223
Statistics 1Var app
219
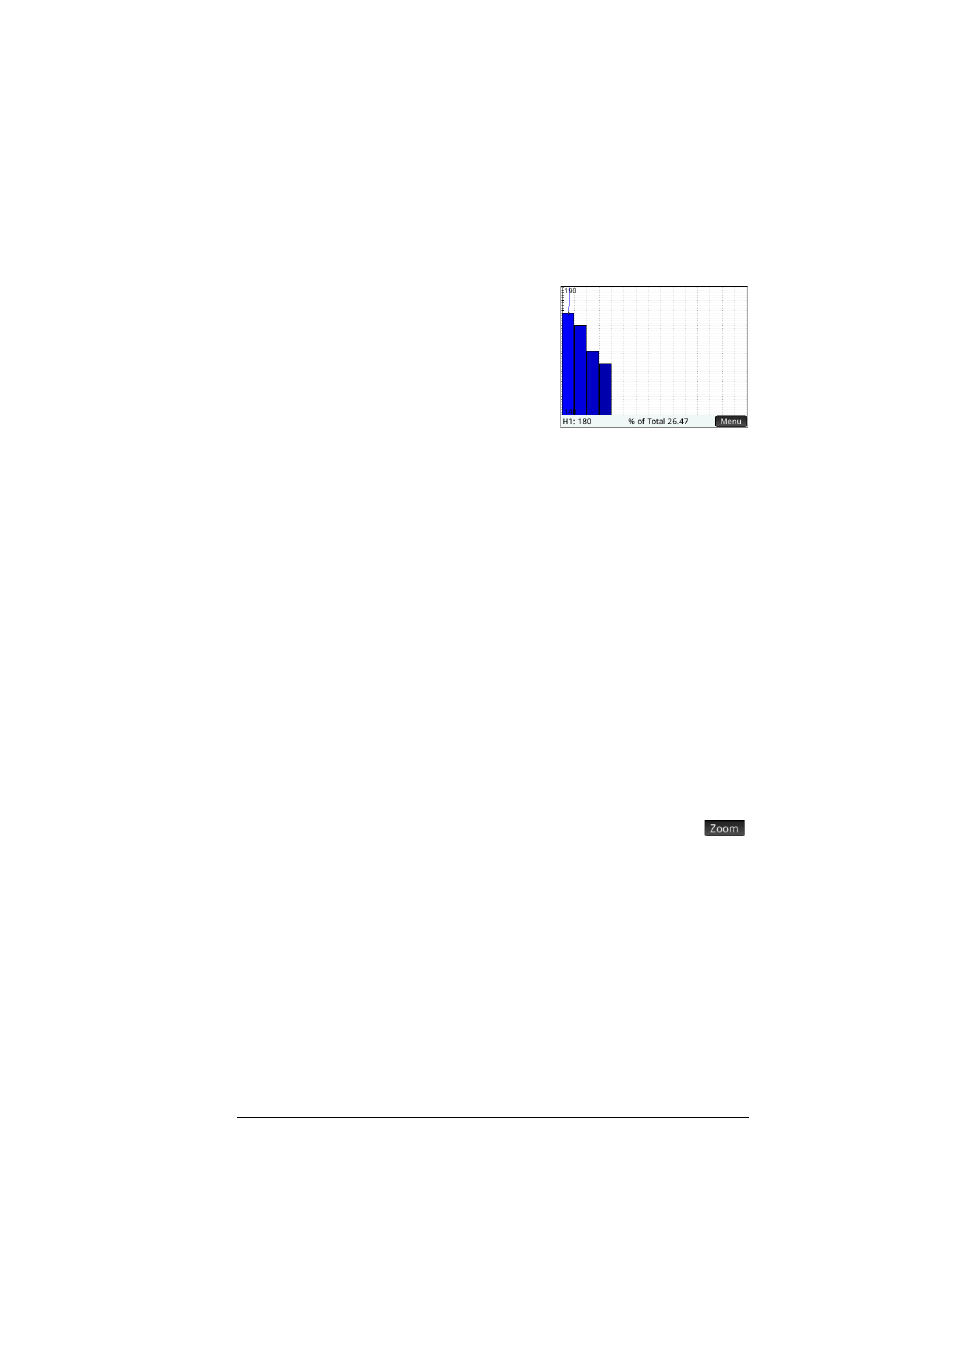
Pareto chart
A pareto chart places the
data in descending
order and displays each
with its percentage of the
whole.
Setting up the plot (Plot Setup view)
The Plot Setup view (
SP
) enables you to specify
many of the same plotting parameters as other apps (such
as
X Rng
and
Y Rng
). There are two settings unique to
the Statistics 1Var app:
Histogram width
H Width
enables you to specify the width of a histogram
bin. This determines how many bins will fit in the display,
as well as how the data is distributed (that is, how many
data points each bin contains).
Histogram range
H Rng
enables you to specify the range of values for a set
of histogram bins. The range runs from the left edge of the
leftmost bin to the right edge of the rightmost bin.
Exploring the graph
The Plot view (
P
) has zooming and tracing options, as
well as coordinate display. The Autoscale option is
available from the View menu (
V
) as well as the
menu.The View menu also enables you to view graphs in
split-screen mode (as explained on page 91).
For all plot types, you can tap and drag to scroll the Plot
view. You can also zoom in or out on the cursor by
pressing
+
and
w
respectively.