Explore statistics – HP Prime Graphing Calculator User Manual
Page 227
Statistics 2Var app
223
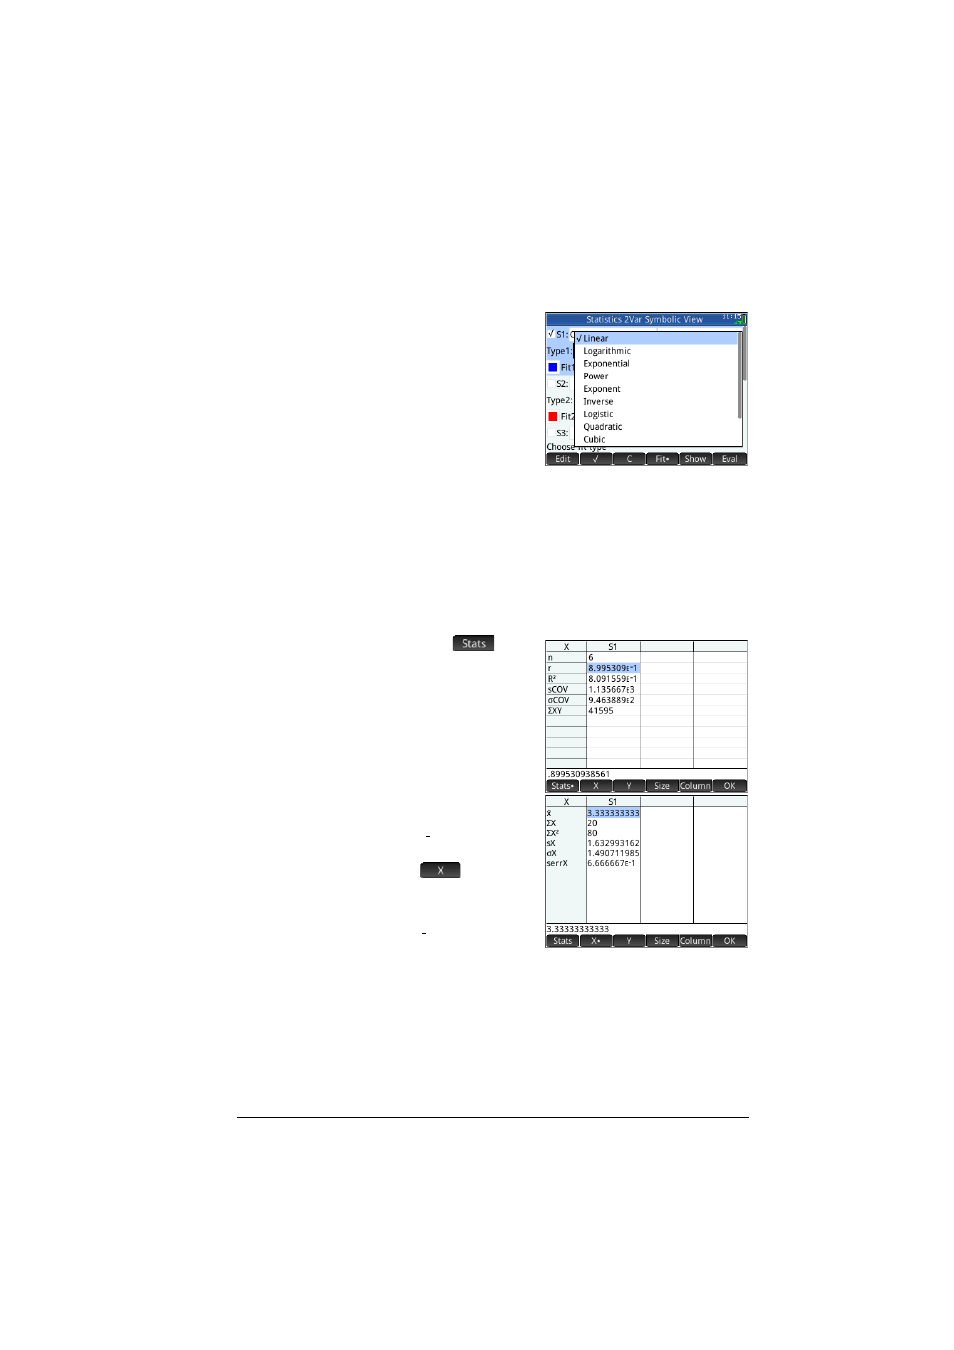
5. Select a fit:
From the
Type 1
field select a fit. In
this example,
select Linear.
6. If you want to
choose a color for
the graph of the
data in Plot view,
see “Choose a color for plots” on page 85.
7. If you have more than one analysis defined in
Symbolic view, deselect any analysis you are not
currently interested in.
Explore statistics
8. Find the correlation, r, between advertising time and
sales:
M
The correlation is
r=0.8995…
9. Find the mean
advertising time
( ).
The mean
advertising time,
, is 3.33333…
minutes.
x
x
See also other documents in the category HP Tablet:
- iPAQ Glisten (185 pages)
- iPAQ Glisten-AT&T (185 pages)
- iPAQ rx5900 Travel Companion (10 pages)
- iPAQ h1900 Pocket PC series (127 pages)
- iPAQ hx2700 Pocket PC series (168 pages)
- QuickSpecs H5400 (13 pages)
- 620LX (172 pages)
- IPAQ H1930 (13 pages)
- 700 Series (204 pages)
- iPAQ h5150 (8 pages)
- Jornada 420 (146 pages)
- iPAQ PC h1910 (2 pages)
- HX2000 (11 pages)
- iPAQ hx2000 Series (3 pages)
- h4000 (141 pages)
- iPAQ HX2495b (10 pages)
- 820e (178 pages)
- 820 (186 pages)
- iPAQ h1910 (105 pages)
- iPAQ hx2790c (10 pages)
- IPAQ Pocket PC hx2110 (7 pages)
- rx3000 Series (301 pages)
- iPAQ hx4700 (169 pages)
- 2490 (14 pages)
- iPAQ hw6500 (170 pages)
- h6300 (190 pages)
- IPAQ HX2750 (9 pages)
- iPAQ h2200 Pocket PC series (125 pages)
- iPAQ Pocket PC h5400 Series (10 pages)
- Jornada 520 (134 pages)
- iPAQ h4100 Pocket PC series (143 pages)
- IPAQ H5100 (169 pages)
- h5400 (273 pages)
- IPAQ RX3000 (60 pages)
- H2200 (9 pages)
- UNIX AA-XXXXX-TF (15 pages)
- Jornada 540 Series (135 pages)
- PC Series (22 pages)
- 430se (151 pages)
- h1937 EN (127 pages)
- PrintCalc 100 (33 pages)
- PrintCalc 100 (32 pages)
- 48gII Graphing Calculator (864 pages)
- 48gII Graphing Calculator (892 pages)
- EliteBook 2740p Tablet-PC (179 pages)