Analytics, Network analysis, Analytics 39 – Badger Meter ReadCenter User Manual
Page 39: Network analysis 39
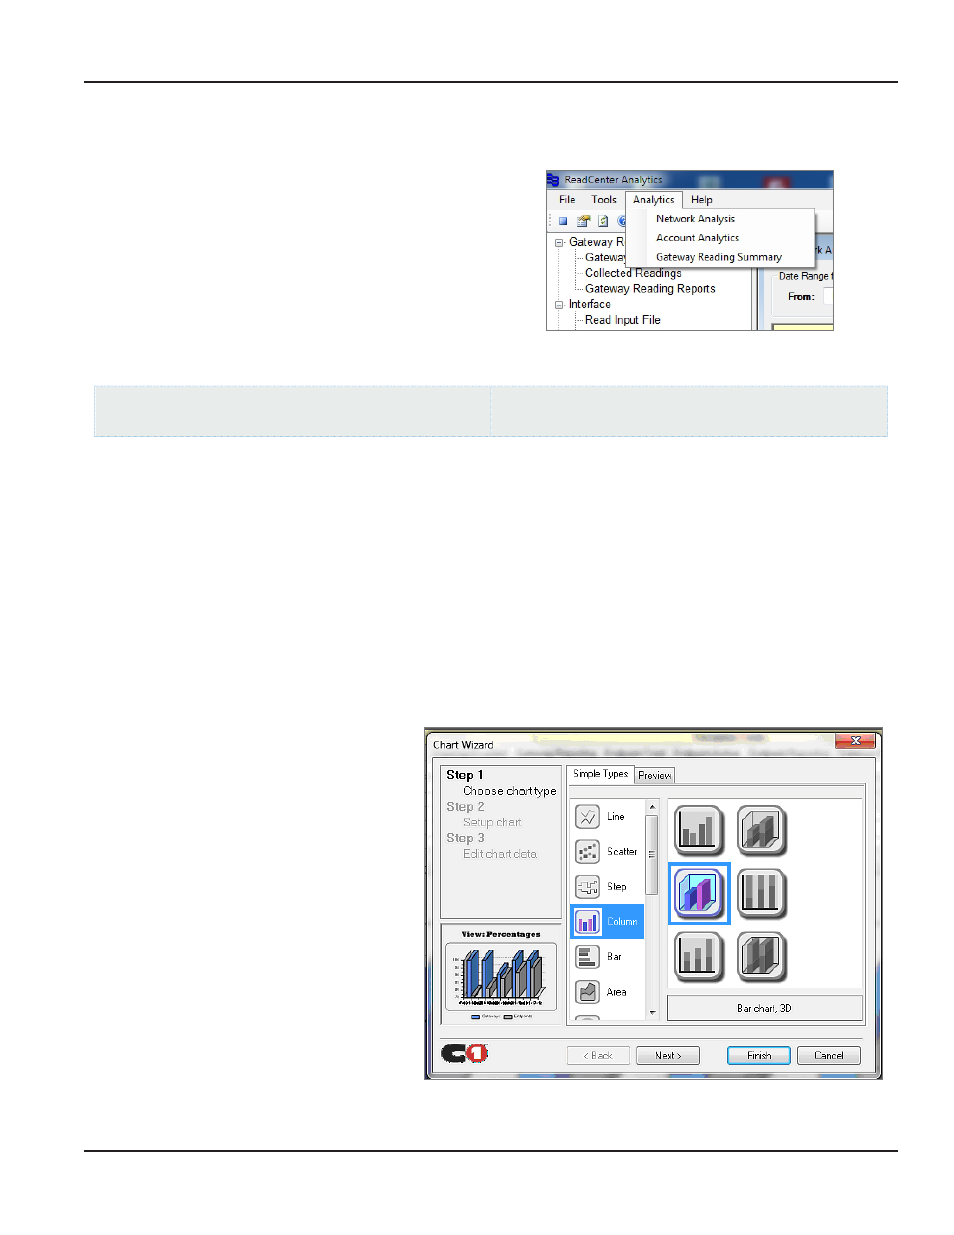
ANALYTICS
The Analytics section is accessed from the main menu bar
•
Network Analysis
•
Account Analytics
•
Gateway Reading Summary
OTE:
N
Network Analytics and Gateway Reading Summary
apply to fixed network only and are not part of
Analytics Mobile
Network Analysis
ReadCenter Analytics
Analytics> Network Analysis
ReadCenter Analytics Mobile
n/a
Fixed Network Only: This section is intended for customers with a fixed network system Customers using ReadCenter
Analytics exclusively for a mobile network may skip this section
The Network Analysis option provides a means to record daily summaries of gateway and endpoint reception totals to allow
viewing over time Use the summaries to monitor system activity and the overall health of the system
OTE:
N
This option is not available with SQL Server Express
A process is executed automatically each day to record the number of total active gateways and endpoints that should have
reported that day along with the number of gateways and endpoints that actually reported The initial view shows activity for
the past week The date range can be modified to show other time periods
Each day’s totals and percentages within the time period are shown in a table view at the top of the screen and in a chart view
in the lower portion of the screen Table data may be saved as a csv file
Chart Options
The Network Analysis chart views can be
customized A variety of chart options are
available and a default chart view is provided
Select Chart Options at the bottom of the
Network Analysis screen and use the wizard to
select a chart type, make color selections and
position the data to create a chart suitable for
the selected information
User Manual
Page 39
June 2014