History report graph – Badger Meter ReadCenter User Manual
Page 32
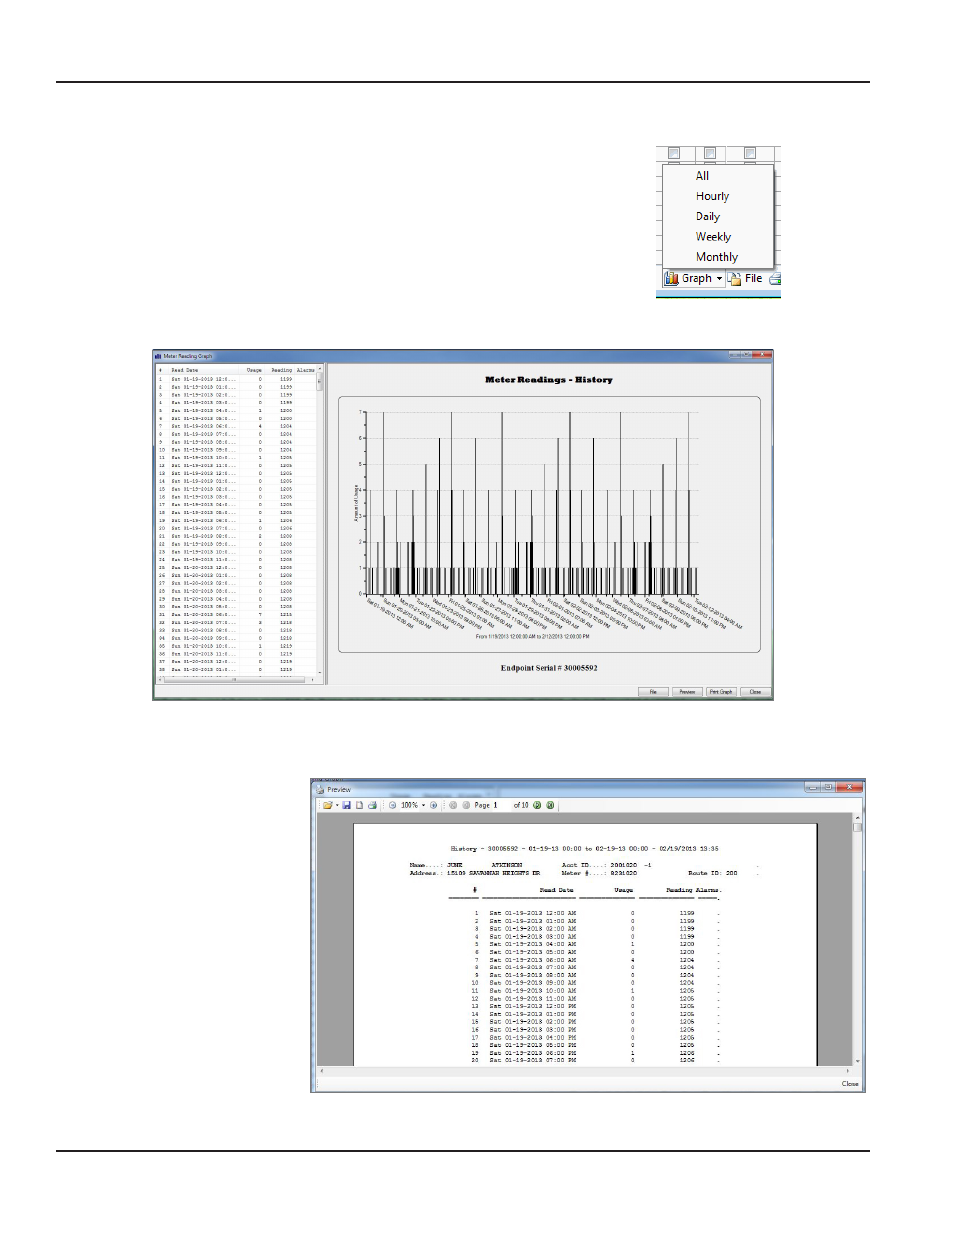
History Report Graph
From a History report, click the Graph button to see usage graph for an
endpoint for the time period selected Use the drop-down menu to select All,
Hourly, Daily, Weekly, or Monthly readings
OTE:
N
The Graph option is available whenever you run a History report
An example of meter readings history in Graph view is shown below The endpoint serial number is shown under the graph
Buttons in Graph Tool Bar
•
Preview: Shows a report of the customer and usage information (Includes print option )
An example of the Preview
screen is shown here
Click the Close button at
the bottom right to return
to the Graph view
•
Print Graph: Opens the
print dialog box to select a
printer
ReadCenter® Analytics & Analytics Mobile
Page 32
June 2014