2 connecting a flow meter or rain gauge – Xylem SDI-12 Data Logger iRIS 220, iRIS 320, iRIS 350, iRIS 150, iRIS 300 User Manual
Page 56
iRIS Datalogger User Guide V1.50
50
iQuest (NZ) Ltd - PO Box 15169, Hamilton, New Zealand Tel: +64 7 857-0810 Fax: +64 7 857-0811 Email: [email protected]
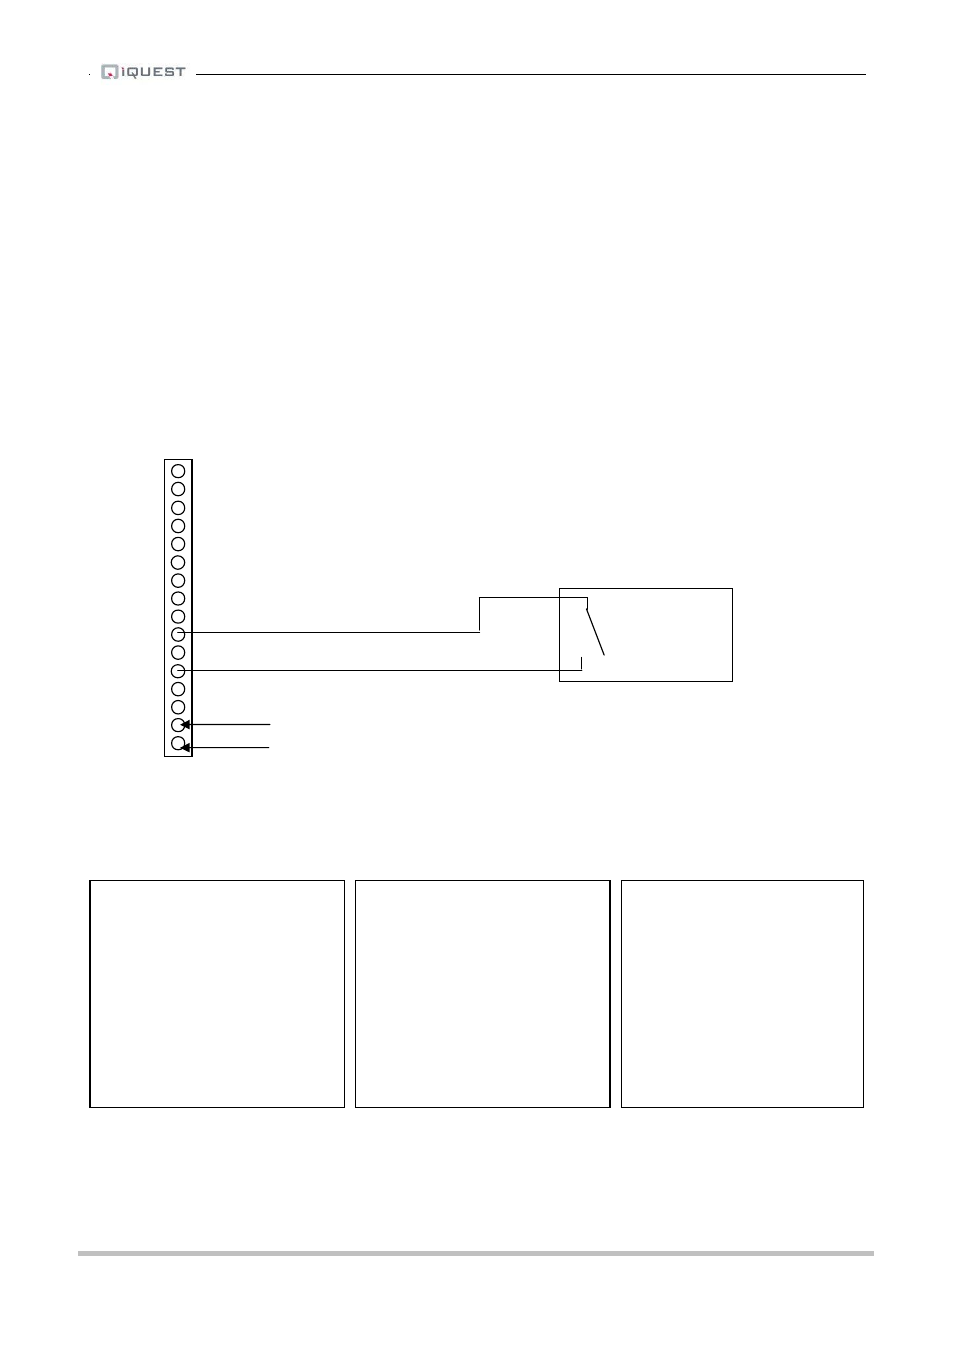
6.2 Connecting a Flow Meter or Rain Gauge
A common use for the iRIS is logging data from pulse sources such as flow meters or rain gauges.
Connecting such devices to the iRIS is very simple – wire the switch between the appropriate digital input
(DIO1 or DIO2) and the digital ground (DGND) terminal. Both of the digital inputs provide a “wetting current”
for clean contact sources, but transistor switches and active signals (ones that supply a voltage) can also be
used. If a transistor switch is used, connect the collector (+) to the digital input and the emitter (-) to the
DGND. See Section 3.5.5 for details on the digital inputs and setting up the input debounce mode.
Both inputs can be used simultaneously and each input has three associated totalisers, which are viewable
from the LCD. See section 5.2.7. These totalisers operate even if the input is not configured as a source to
one of the six virtual sensors.
The diagram below shows the typical connection diagram for such an installation. It assumes the use of
DIO1 as the pulse input channel. The charging source can be any d.c supply from 15V – 30V, including a
directly connected solar panel.
TOP
iRIS I/O Connector
The sensor should be configured for the correct channel, scaling and logging regime as described in section
4.4.8. Event mode (sensor mode=2) can be used to reduce the quantity of data logged, especially for rainfall
where the actual data density is low.
Three typical sensor configuration examples for this type of instrument are shown below. The instrument is a
0.5mm tipping bucket rain gauge and is logged every 15 minutes for examples 1 and 2.
* Sensor 1 Cfg
(Now: 0.0)
0 Exit
1 Source [5: Pulse1]
2 Name [Rainfall]
3 Mode [Instant]
4 Multiplier [ 0.500]
5 Offset [ 0.0000]
6 Log Multiplier [10]
7 Log Rate [15min]
8 Alarms
9 Data
* Sensor 1 Cfg
(Now: 0.0)
0 Exit
1 Source [5: Pulse1]
2 Name [Rainfall]
3 Mode [Event]
4 Multiplier [ 0.500]
5 Offset [ 0.0000]
6 Log Multiplier [10]
7 Log Rate [15min]
8 Alarms
9 Data
* Sensor 1 Cfg
(Now: 0.0)
0 Exit
1 Source [5: Pulse1]
2 Name [Rainfall]
3 Mode [Event]
4 Multiplier [ 0.500]
5 Offset [ 0.0000]
6 Log Multiplier [10]
7 Log Rate [0min]
8 Alarms
9 Data
Example 1: Normal Timed
This logs the total every 15
minutes, even if it is zero. This
produces the most data as
every “time slot” has an
associated sample.
Example 2: Timed Event
This logs the total every 15
minutes only if it is non-zero. It
also inserts a zero record one
log interval earlier, if there has
not been a value logged.
Example 3: True Event
This logs every event to a one
second resolution. If there is
more than one count in a
second, the total is logged. No
zero samples are logged.
AI4
AI3
AI2
AI1
AGND
AOUT
DIO4
DIO3
DIO2
DIO1
SDI-12
DGND
12V+
GND (-)
VIN+
GND (-)
Flow Meter
or
Rain Gauge
Charging source e.g. solar panel