Garmin G1000 Mooney M20TN User Manual
Page 254
Garmin G1000 Pilot’s Guide for the Mooney M20M/M20R/M20TN
190-00647-00 Rev. A
6-18
HAZARD AVOIDANCE
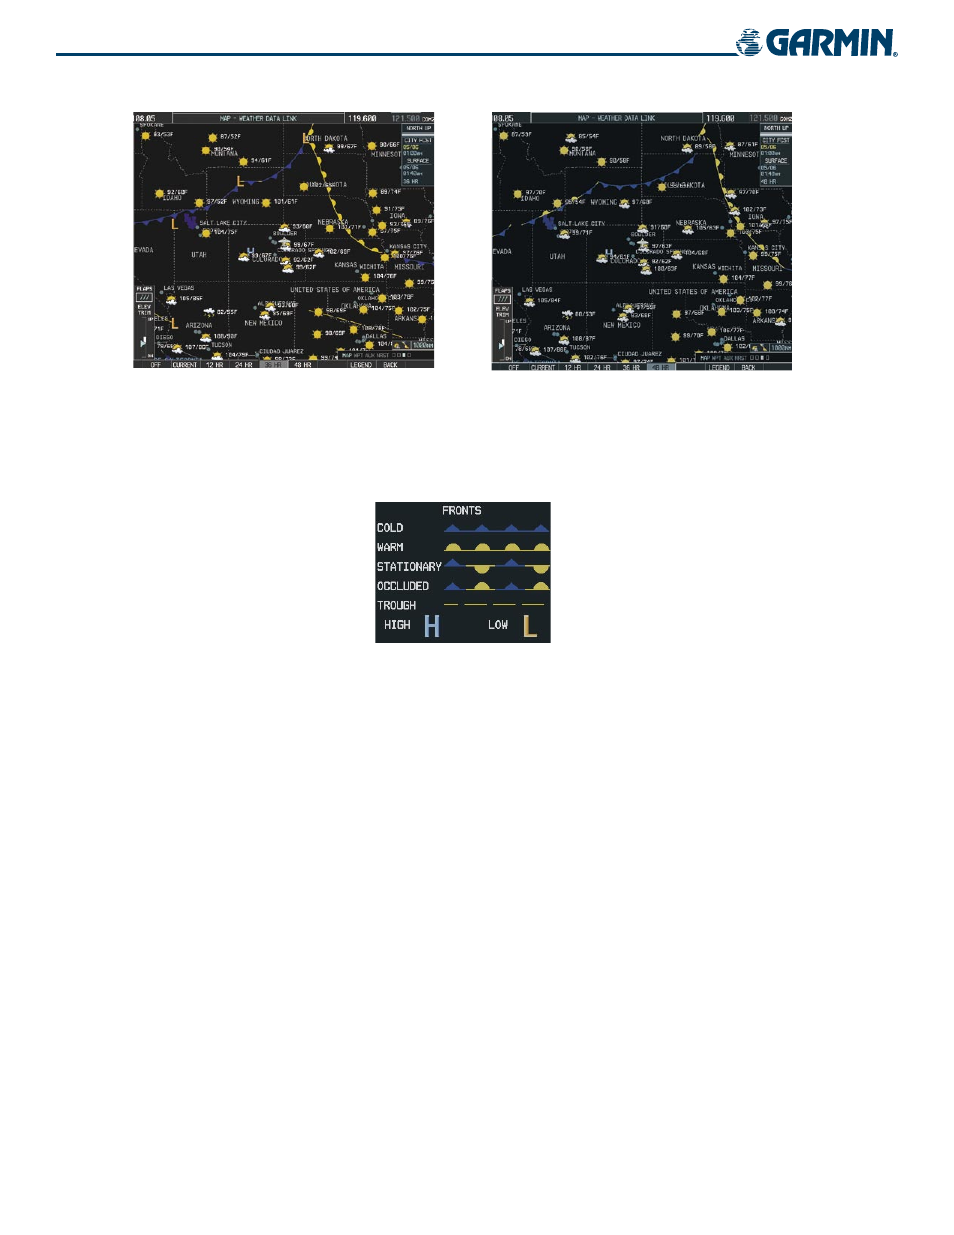
Figure 6-22 36-Hour Surface Analysis Data
Figure 6-23 48-Hour Surface Analysis Data
To display the Surface Analysis (Figure 6-24) and City Forecast legend, press the LEGEND Softkey when
Surface Analysis and City Forecast are selected to be displayed.
Figure 6-24 Surface Analysis Legend
F
REEZING
L
EVEL
Freezing Level data shows the color-coded contour lines for the altitude and location at which the first
isotherm is found. When no data is displayed for a given altitude, the data for that altitude has not been
received, or is out of date and has been removed from the display. New data appears at the next update.
This manual is related to the following products: