Bar and column charts – Apple Pages 2 User Manual
Page 213
Chapter 9
Creating Charts
213
To put shadows on individual pie wedges:
1
Select the chart or individual pie wedges.
2
In the Chart Inspector, click the Series button.
3
Choose Individual from the Shadow pop-up menu.
4
In the Graphic Inspector, set shadow attributes. (For more information, see “Adding
To put a shadow on the whole pie:
1
Select the chart.
2
In the Series pane of the Chart Inspector, choose Group from the Shadow
pop-up menu.
3
In the Graphic Inspector, set shadow attributes. (For more information, see “Adding
You can also change the opacity of the chart and individual chart elements, such as
the legend. (For more information, see “Adjusting Opacity” on page 154.)
To rotate a pie chart:
m
Select the chart and drag the Rotation Angle wheel in the Series pane of the Chart
Inspector, or type a value in the Rotation Angle field.
Bar and Column Charts
You can apply shadows to individual data series or to the entire chart. You can adjust
the opacity for the chart as a whole or for individual series (but not individual bars).
You can also adjust the spacing between data sets or individual bars.
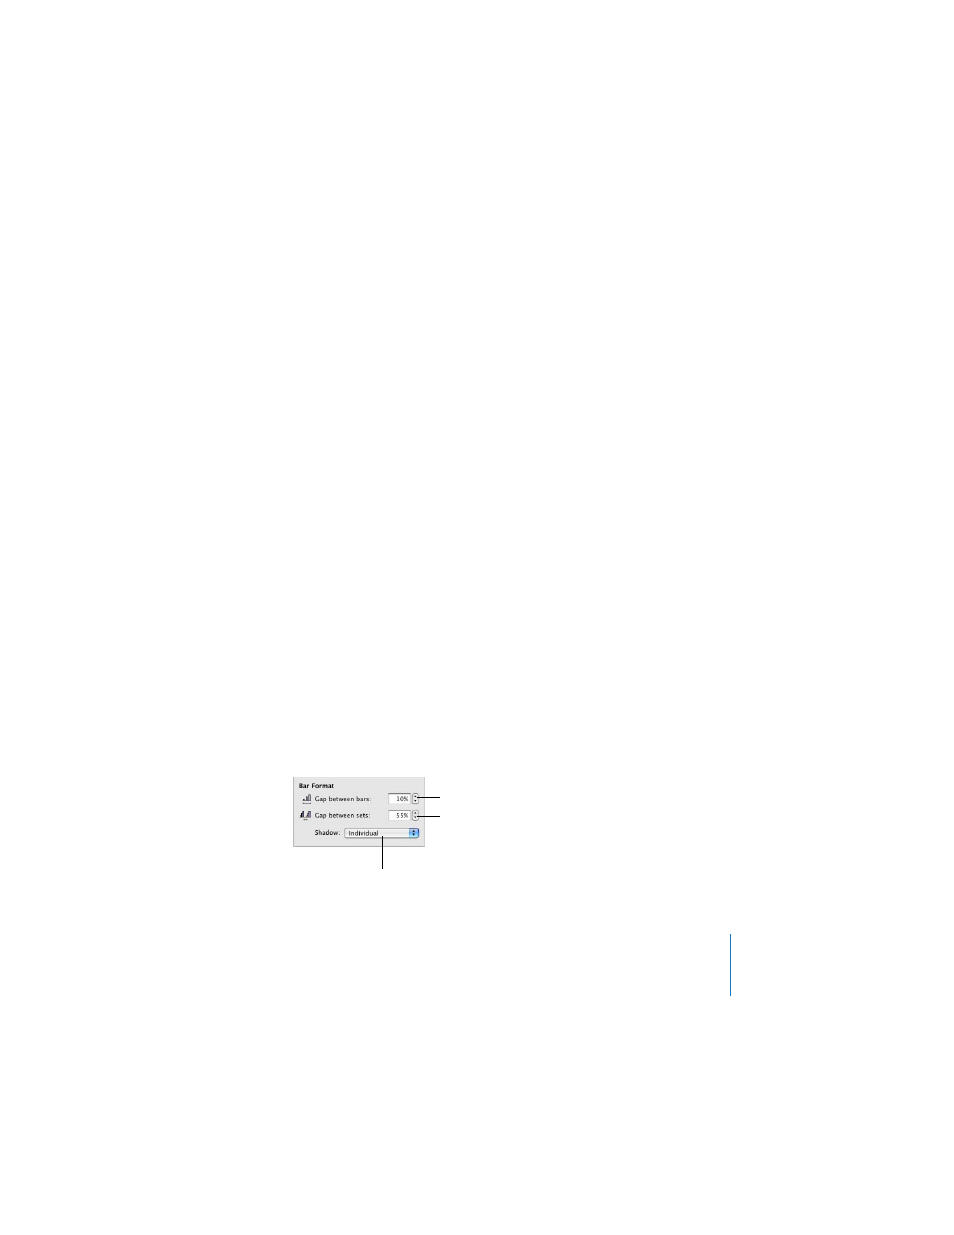
To adjust spacing between individual bars or data sets:
1
Select the chart.
2
In the Chart Inspector, click the Series button if it is not already selected.
Separate the individual bars
in the chart.
Separate the data sets in
the chart.
Add shadows to bars
or data sets.