Formatting charts, Setting chart colors – Apple Pages 2 User Manual
Page 206
206
Chapter 9
Creating Charts
Formatting Charts
You can resize and reposition charts and chart legends just like any other object. You
can format chart elements—fonts, colors, axis labels, and tick marks—to suit your
preferences. You can hide the chart legend. You can adjust the angle and lighting style
of 3D charts. Most chart formatting tasks are done using the Chart Inspector. You can
also accomplish many tasks using shortcut menus.
To open a chart’s shortcut menu:
m
Hold down the Control key and click a chart.
To hide the chart legend:
1
Click Inspector in the toolbar (or choose View > Show Inspector), and then click the
Chart Inspector button.
2
Select the chart.
3
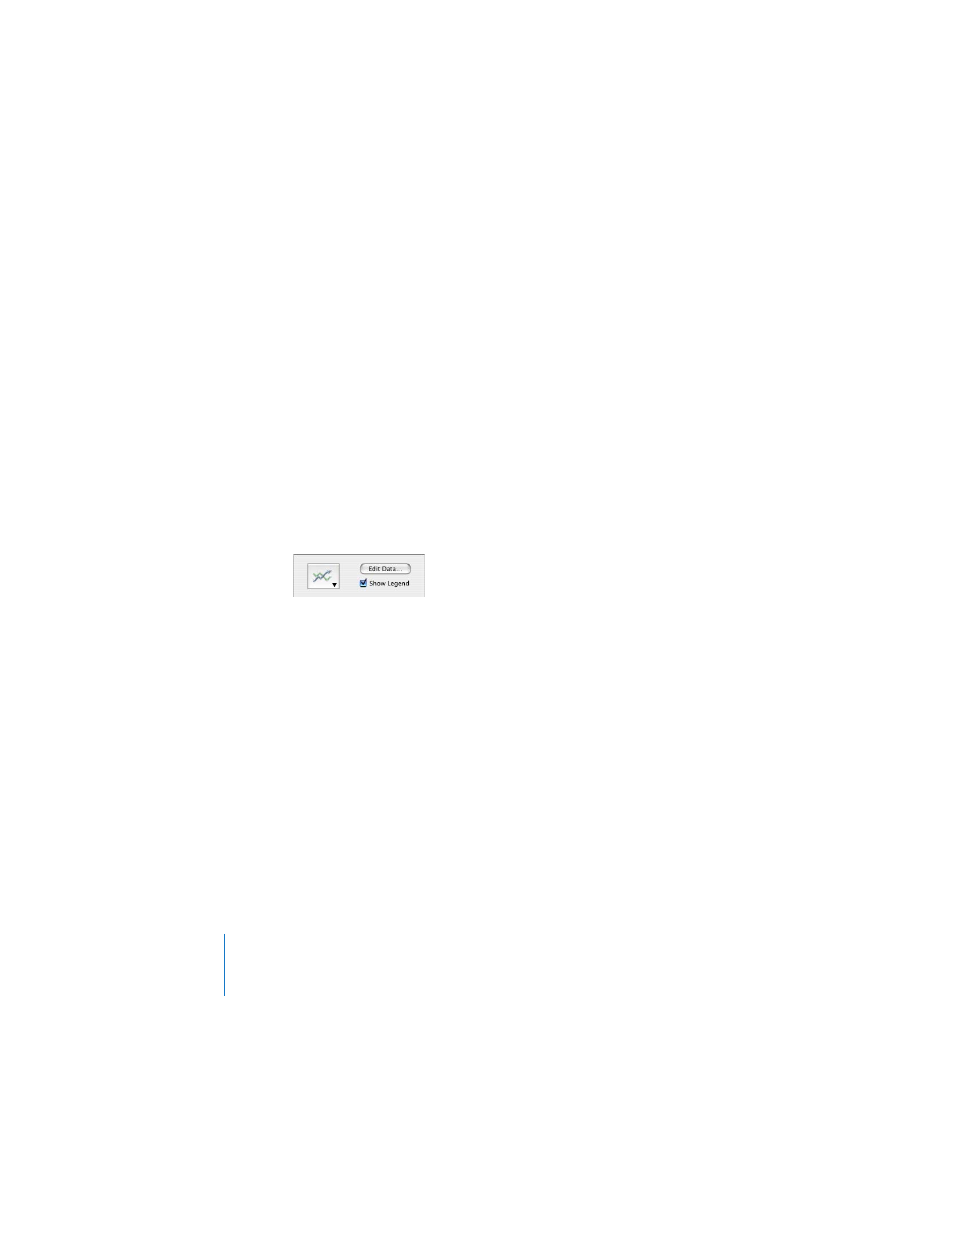
In the Chart Inspector, deselect the checkbox labeled Show Legend.
You can also select the legend and press Delete; you can always display the legend
again by selecting the Show Legend checkbox.
Setting Chart Colors
You can format the bars, wedges, and area shapes that appear on each type of chart
just as you format any other drawn object. You can give them color fills, gradient fills,
image fills, shadows, opacity, or different line styles. You set these attributes in the
Graphic Inspector.
To change the color or image in a bar, wedge, or area shape:
1
Select the item (bar, wedge, or area shape).
If you select one bar in a bar chart, all the bars in that data series are selected.
2
Change chart properties as you would for any drawn object using the Graphic
Inspector.
For more information about changing object properties, see Chapter 7, “Changing