Calculations – Campbell Scientific CR9000X Measurement and Control System User Manual
Page 221
Section 6. Data Table Declarations and Output Processing Instructions
Calculations:
The calculations performed under the hood by the WindVector
instruction are described below for informational purposes only.
NOTE
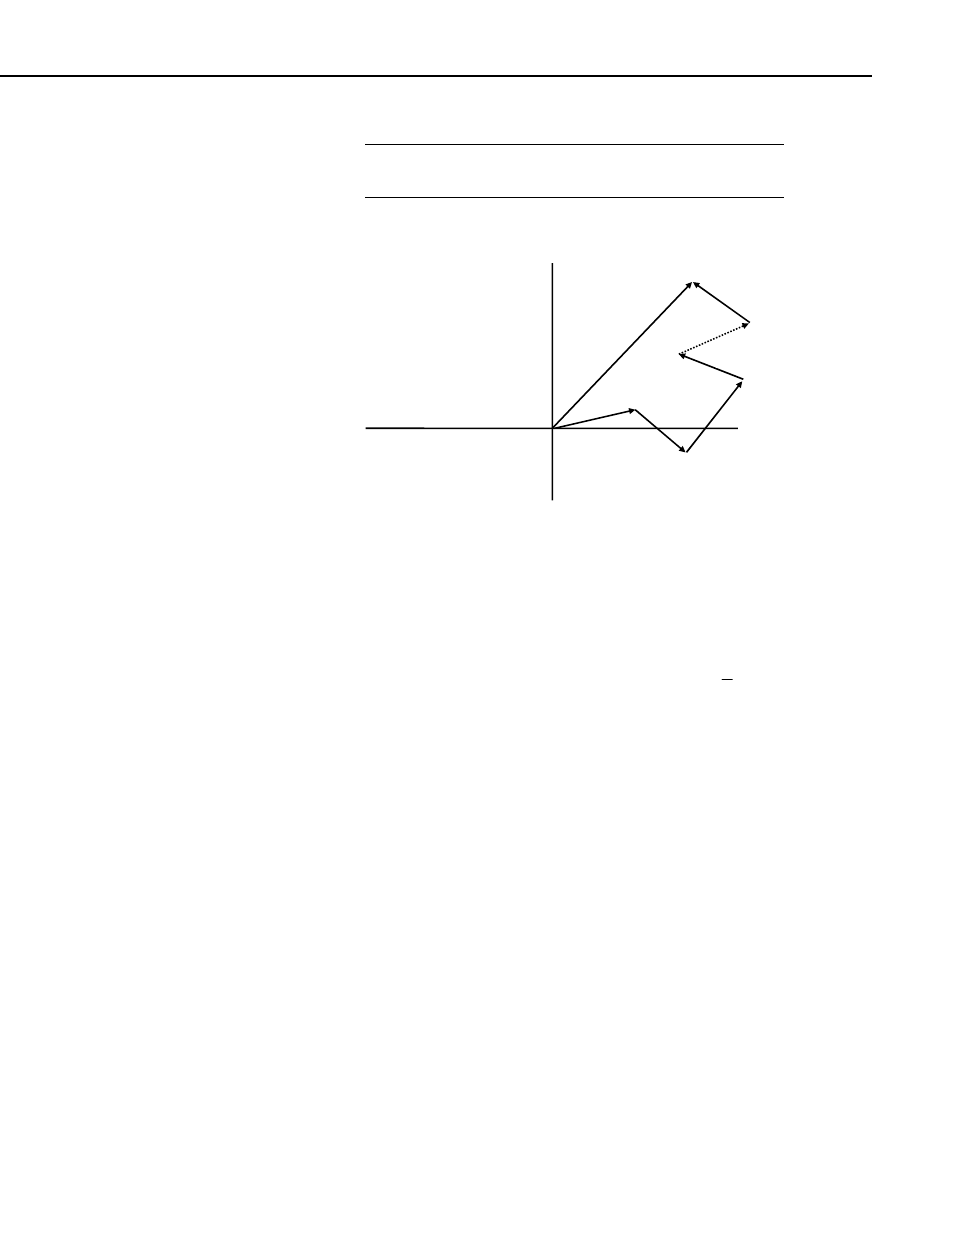
FIGURE 6.4-2. Input Sample Vectors
In Figure 6.4-2, the short, head-to-tail vectors are the input sample vectors
described by and
s
i
Θ
i
, the sample speed and direction, or by Ue
i
and Un
i
, the
east and north components of the sample vector. At the end of output interval
T, the sum of the sample vectors is described by a vector of magnitude U and
direction
Θu. If the input sample interval is t, the number of samples in output
interval
T
is N
T t
= / . The mean vector magnitude is
U
U N
=
/
.
Scalar mean horizontal wind speed, S:
S=(
Σs
i
)/N
where in the case of orthogonal sensors:
S
i
=(Ue
i
2
+Uni
2
)
1/2
Unit vector mean wind direction,
Θ1:
Θ1=Arctan (Ux/Uy)
where
Ux=(
Σsin Θ
i
)/N
Uy=(
Σcos Θ
i
)/N
or, in the case of orthogonal sensors
Ux=(
Σ(Ue
i
/U
i
))/N
Uy=(
Σ(Un
i
/U
i
))/N
where U
i
=(Ue
i
2
+Un
i
2
)
1/2
Standard deviation of wind direction,
σ(Θ1), using Yamartino algorithm:
σ(Θ1)=arc sin(ε)[1+0.1547 ε
3
]
where,
ε=[1-((Ux)
2
+(Uy)
2
)]
1/2
s
n
Θu
s
2
North
U
s
4
s
s
3
1
East
6-37