Crossing 2nd dim – Campbell Scientific CR9000X Measurement and Control System User Manual
Page 208
Section 6. Data Table Declarations and Output Processing Instructions
0
0.5
1
1.5
2
2.5
3
3.5
0
1
2
3
4
5
6
Sample Number
Signal Level
Crossing Levels
Crossing Source
2nd Dim Boundary
2ndDim Source
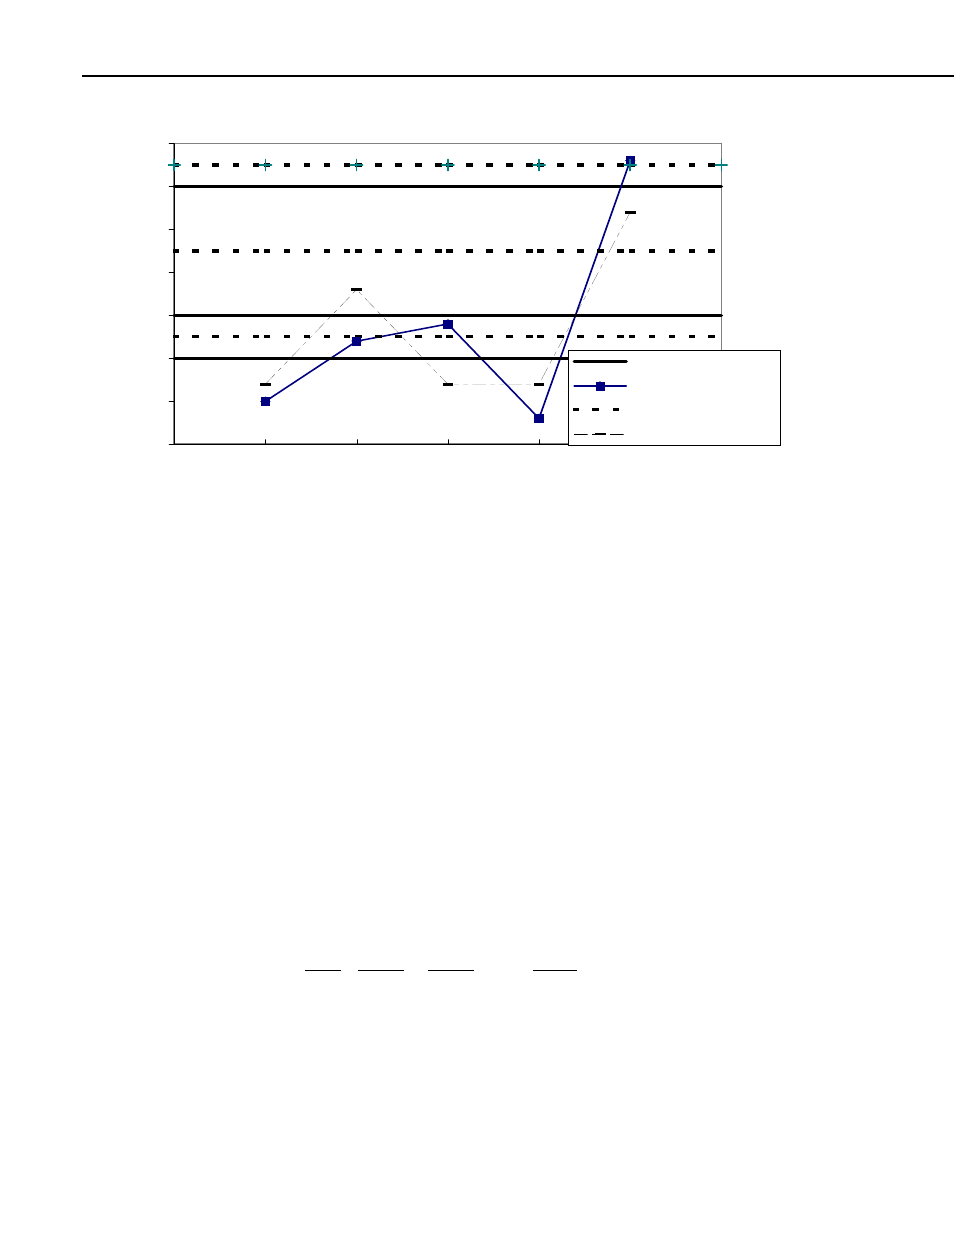
FIGURE 6.4-2. Crossing Data with Second Dimension Value
2 Dim Level Crossing Example: Figure 6.4-2 depicts the data input for a two
dimensional level crossing histogram that has three level crossing values (1,
1.5, 3) and three SecondDim values (1.25, 2.25, 3.25). This results in a level
crossing histogram having 9 bins. In this example, a count would go to bin:
Bin(1,1) when LC Crosses 1
and
2nd Value < 1.25
Bin(1,2) when LC Crosses 1
and 1.25
≤ 2nd Value < 2.25
Bin(1,3) when LC Crosses 1
and 2.25
≤ 2nd Value < 3.25
Bin(2,1) when LC Crosses 1.5 and
2nd Value < 1.25
Bin(2,2) when LC Crosses 1.5 and 1.25
≤ 2nd Value < 2.25
Bin(2,3) when LC Crosses 1.5 and 2.25
≤ 2nd Value < 3.25
Bin(3,1) when LC Crosses 3
and
2nd Value < 1.25
Bin(3,2) when LC Crosses 3
and 1.25
≤ 2nd Value < 2.25
Bin(3,3) when LC Crosses 3
and 2.25
≤ 2nd Value < 3.25
Using the sample data depicted in Figure 6.4-2, the values loaded in to the
LevelCrossing bins are as listed under Action below:
Crossing
2nd
Dim
Point Source Source
Action
1
0.5
0.7
First value, no counts
2
1.2
1.8
Add 1 count to Bin(1,2). LC signal crossed1,
2nd value = 1.8
3
1.4
0.7
No levels crossed, no counts
4
0.3
0.7
Falling Edge crossing, no counts
5
3.3
2.7
Add 1 to Bins(1,3),(2,3),&(3,3). LC signal
crossed 1,1.5, & 3, 2nd value=2.7
6-24