Campbell Scientific CR9000X Measurement and Control System User Manual
Page 212
Section 6. Data Table Declarations and Output Processing Instructions
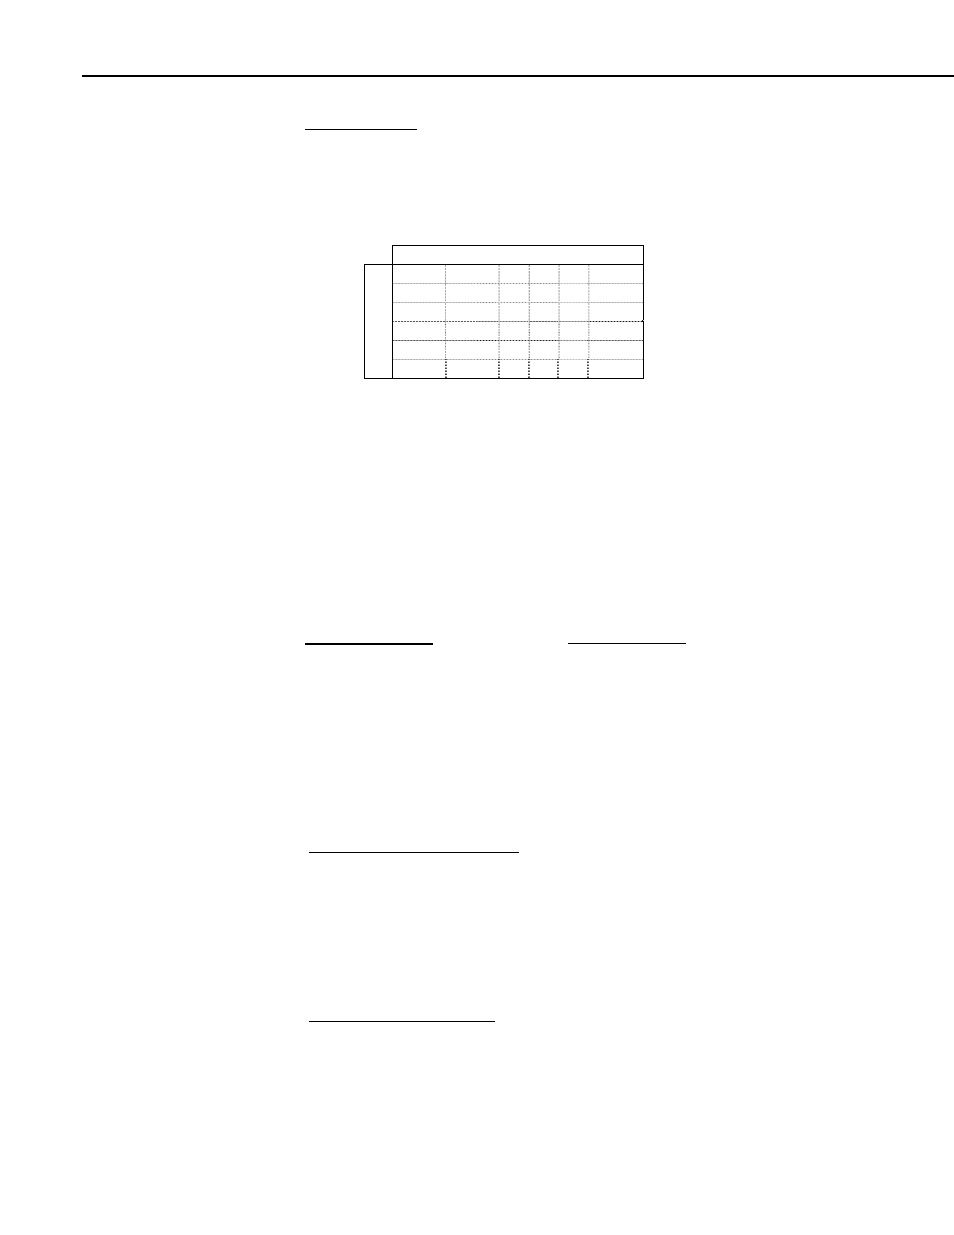
Output Generated: The number of elements in the output array that is stored to
the Data Table is equal to (Number of Mean Bins) x (Number of Amplitude
Bins). If the number of mean ranges equals M, and the number of amplitude
ranges equals A, then the output is arranged sequentially in the order
[C(1,1), C(1,2), … C(1,A), C(2,1), C(2,2), … C(M,1), C(M,2) … C(M,A) ].
Shown in a two dimensional array, the output would look like:
# of Amplitude Range Values
C
1,1
C
1,2
. . . C
1,A
C
2,1
C
2,2
. . . C
2,A
.
.
.
.
.
.
.
.
.
.
.
.
# of Mean Ranges
C
M,1
C
M,2
. . . C
M,A
The minimum distance between peak and valley, MinAmp, determines the
smallest amplitude cycle that will be counted. The distance should be less than
the amplitude bin width ([UpperLimit - LowerLimit]/no. amplitude bins) or
cycles with amplitudes in the range of the first bin will not be counted.
However, if the MinAmp value is set too small, processing time will be
consumed counting "cycles" which are in reality just noise.
The histogram can have either open or closed form. In the open form, an cycle
that has an amplitude greater than the range of the maximum bin is counted in
one of the maximum Amp bins. Also, a cycle that has a mean value less than
the lower limit or greater than the upper limit is counted in one of the minimum
or maximum mean bins. In the closed form, a cycle that is beyond the
amplitude or mean limits is not counted.
Rainflow Example: Parameter
Settings
Set Mean's LowerLimit to -500
LowLim = -500
Set Mean's UpperLimit to 500
UpLim
= 500
The number of mean rows is 2
MeanDim = 2
The number of amplitude columns is 5 AmpDim = 5
Data Type
IEEE4
Disable Variable (don't process NANs) Souce = NAN in DisableVar
Don't reset, output total, open form
Form = 110
The instruction would look like:
RainFlow (Source, IEEE4, Source = NAN, 2, 5, -500,500, 10, 110)
Resultant Amplitude Bin Settings
Full amplitude range is 1000:
500 - (-500) = 1000.
Individual amplitude column size is 200: 1000/5 = 20.
1
rst
column includes cycles with amplitude values: 0
≤ A < 200
2
nd
column includes cycles with amplitude values: 20
≤ A < 400
3
rd
column includes cycles with amplitude values: 40
≤ A <
600
4
th
column includes cycles with amplitude values: 60
≤ A <
800
5
th
column includes cycles with amplitude values: 80
≤ A <
1000
Resultant Mean Row Settings
Full mean range is 1000
500 - (-500) = 1000.
Individual mean bin row range is 500 1000/2 = 500.
1
rst
row includes cycles having mean values: -500
≤ M < 0
2
nd
row includes cycles having mean values:
0
≤ M < 500
6-28