Measured raw data – Campbell Scientific CR9000X Measurement and Control System User Manual
Page 220
Section 6. Data Table Declarations and Output Processing Instructions
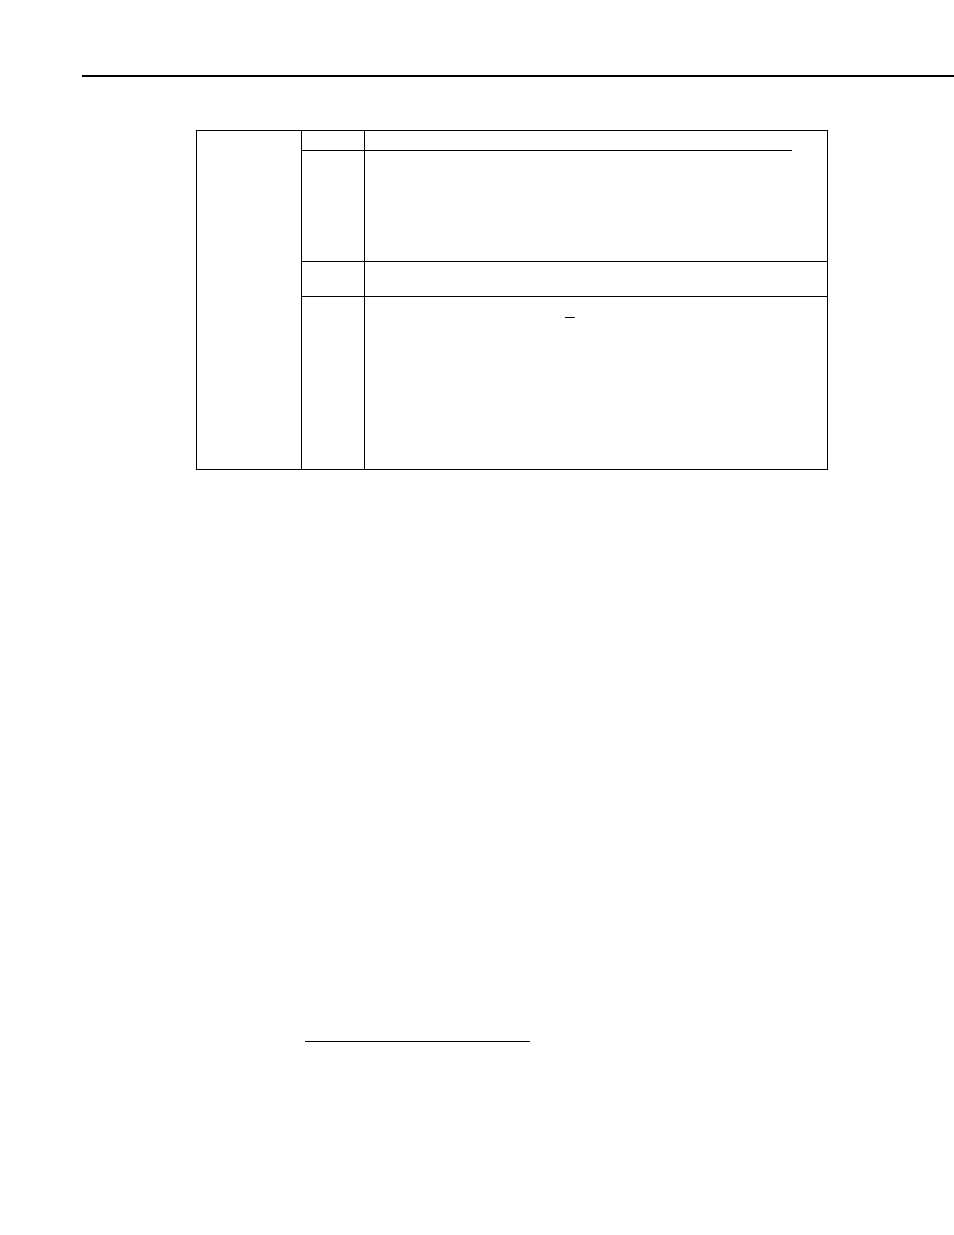
OutputOpt
Value
Outputs (for each rep)
Constant
0 1. Mean horizontal wind speed, S.
2. Unit vector mean wind direction,
Θ1.
3. Standard deviation of wind direction,
σ(Θ1).
Standard deviation is calculated using the Yamartino algorithm. This option
complies with EPA guidelines for use with straight-line Gaussian dispersion
models to model plume transport.
1 1. Mean horizontal wind speed, S.
Unit vector mean wind direction,
Θ1.
2
1. Mean horizontal wind speed, S.
2. Resultant mean wind speed,
U
.
3. Resultant mean wind direction,
Θu.
4. Standard deviation of wind direction,
σ(Θu).
This standard deviation is calculated using Campbell Scientific's wind speed
weighted algorithm.
Use of the Resultant mean horizontal wind direction is not recommended for
straight-line Gaussian dispersion models, but may be used to model transport
direction in a variable-trajectory model.
Standard deviation can be processed one of two ways: 1) using every sample
taken during the output period (enter 0 for the Subinterval parameter), or 2) by
averaging standard deviations processed from shorter sub-intervals of the
output period. Averaging sub-interval standard deviations minimizes the effects
of meander under light wind conditions, and it provides more complete
information for periods of transition
.
Standard deviation of horizontal wind fluctuations from sub-intervals is
calculated as follows:
σ(Θ)=[((σΘ
1
)
2
+(
σΘ
2
)
2
...+(
σΘ
M
)
2
)/M]
1/2
where
σ(Θ) is the standard deviation over the output interval, and σΘ
1
...
σΘ
M
are sub-interval standard deviations.
A sub-interval is specified as a number of scans. The number of scans for a
sub-interval is given by:
Desired sub-interval (secs) / scan rate (secs)
For example if the scan rate is 1 second and the Data Interval is 60 minutes, the
standard deviation is calculated from all 3600 scans when the sub-interval is 0.
With a sub-interval of 900 scans (15 minutes) the standard deviation is the
average of the four sub-interval standard deviations. The last sub-interval is
weighted if it does not contain the specified number of scans.
Measured raw data:
S
i
= horizontal wind speed
Θ
i
= horizontal wind direction
Ue
i
= east-west component of wind
Un
i
= north-south component of wind
N = number of samples
1
EPA On-site Meteorological Program Guidance for Regulatory Modeling
Applications.
6-36