1 measured raw data, 2 calculations – Campbell Scientific CR1000 Measurement and Control System User Manual
Page 190
Section 7. Installation
190
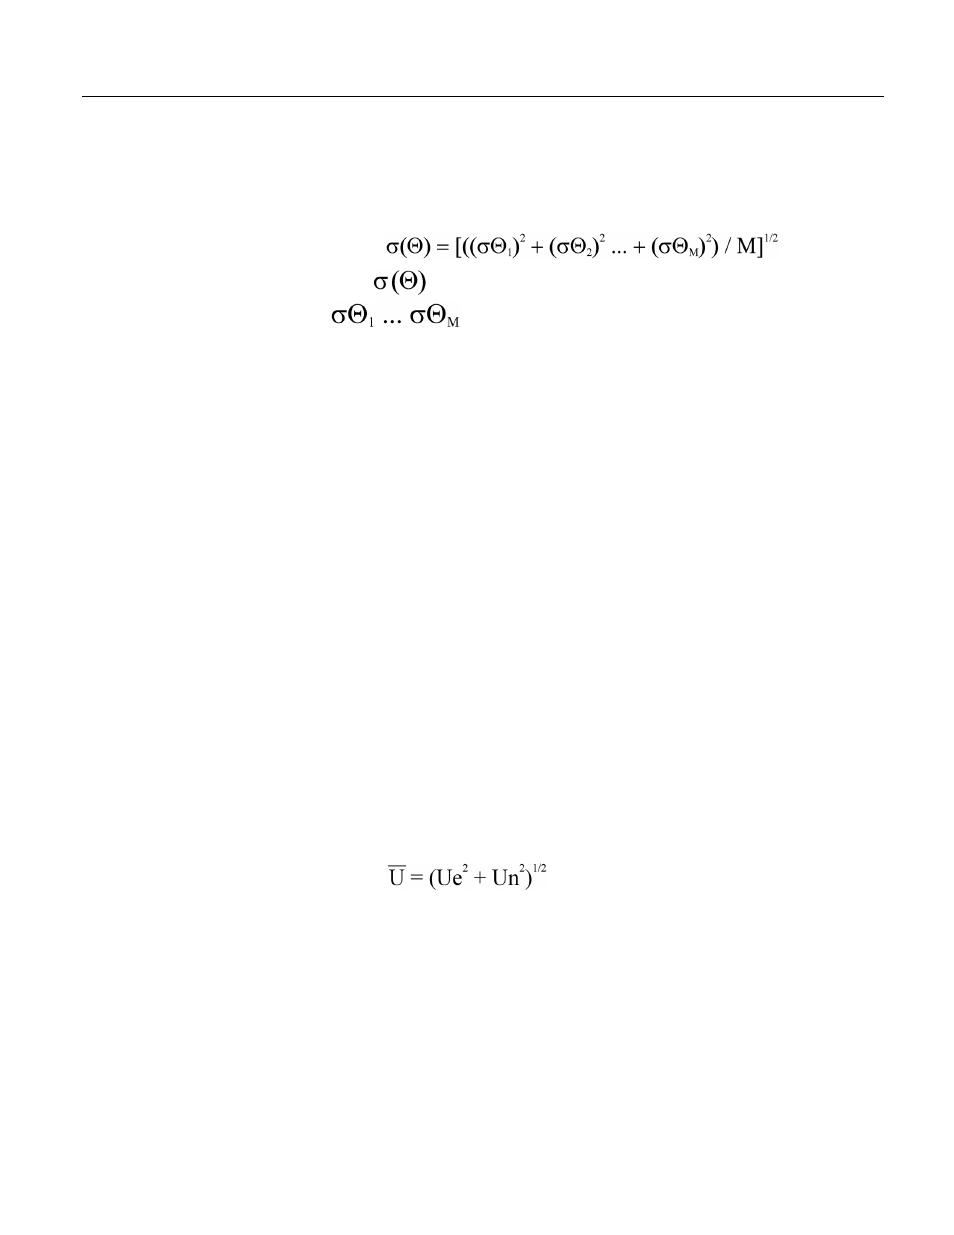
Standard deviation of horizontal wind fluctuations from sub-intervals is calculated
as follows:
where:
is the standard deviation over the data-storage interval, and
are sub-interval standard deviations. A sub-interval is
specified as a number of scans. The number of scans for a sub-interval is given
by:
Desired sub‐interval (secs) / scan rate (secs)
For example, if the scan rate is 1 second and the data interval is 60 minutes, the
standard deviation is calculated from all 3600 scans when the sub-interval is 0.
With a sub-interval of 900 scans (15 minutes) the standard deviation is the
average of the four sub-interval standard deviations. The last sub-interval is
weighted if it does not contain the specified number of scans.
The EPA recommends hourly standard deviation of horizontal wind direction
(sigma theta) be computed from four fifteen-minute sub-intervals.
7.8.5.2.1 Measured Raw Data
• S
i
: horizontal wind speed
• Θ
i
: horizontal wind direction
• Ue
i
: east-west component of wind
• Un
i
: north-south component of wind
• N: number of samples
7.8.5.2.2 Calculations
Mean Wind Vector
Resultant mean horizontal wind speed, Ū: