HP XP P9500 Storage User Manual
Page 97
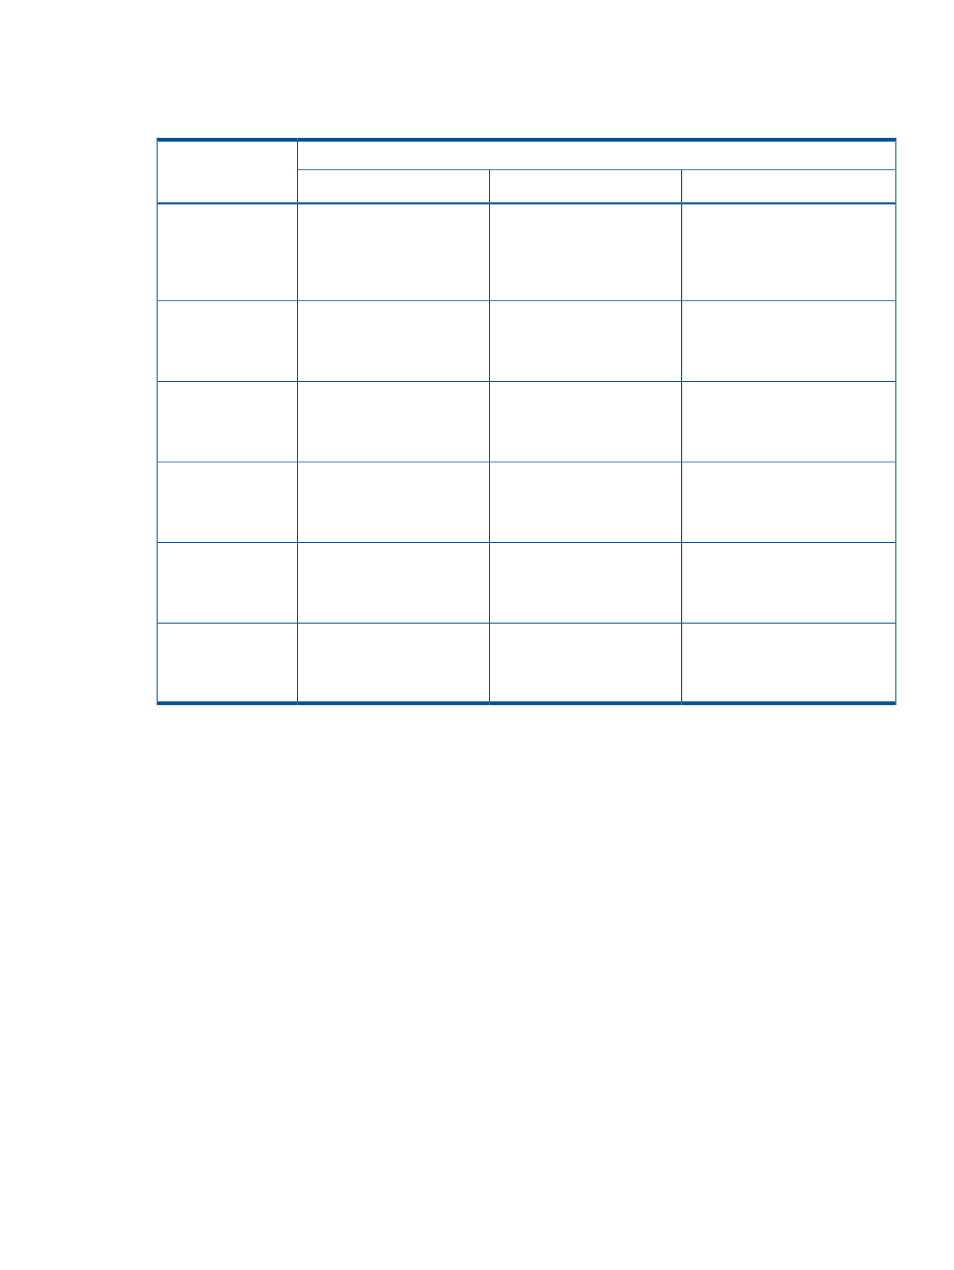
The following table shows how tiering policy is shown in the performance graph. How the graph
appears depends on the number of tiers set in a pool and tiering policy level selected when viewing
the performance graph.
Number of tiers in pool
Tiering level selected
with performance
graph
3 tiers
2 tiers
1 tier
In the performance graph, you
can display a frequency
In the performance graph,
you can display a frequency
In the performance graph,
you can display a frequency
All
distribution of a THP V-VOL, set
to all tiers.
distribution of a THP V-VOL
assigned to level ALL, 2, 3, or
4.
distribution of a THP V-VOL
assigned to any tiering policy.
In the performance graph, you
can display the frequency
In the performance graph,
you can display the frequency
You cannot display the
frequency distribution of this
Level 1
distribution of a THP V-VOL set to
level 1.
distribution of a THP V-VOL
assigned to level 1.
level unless you use the All
setting.
In the performance graph, you
can display the frequency
You cannot display the
frequency distribution of this
Same as level 1.
Level 2
distribution of a THP V-VOL set to
level 2.
level unless you use the All
setting.
In the performance graph, you
can display the frequency
Same as level 2.
Same as level 1.
Level 3
distribution of a THP V-VOL set to
level 3.
In the performance graph, you
can display the frequency
Same as level 2.
Same as level 1.
Level 4
distribution of a THP V-VOL set to
level 4.
In the performance graph, you
can display the frequency
In the performance graph,
you can display the frequency
Same as level 1.
Level 5
distribution of a THP V-VOL set to
level 5.
distribution of a THP V-VOL
set to level 5.
Smart Tiers
97