HP XP P9500 Storage User Manual
Page 84
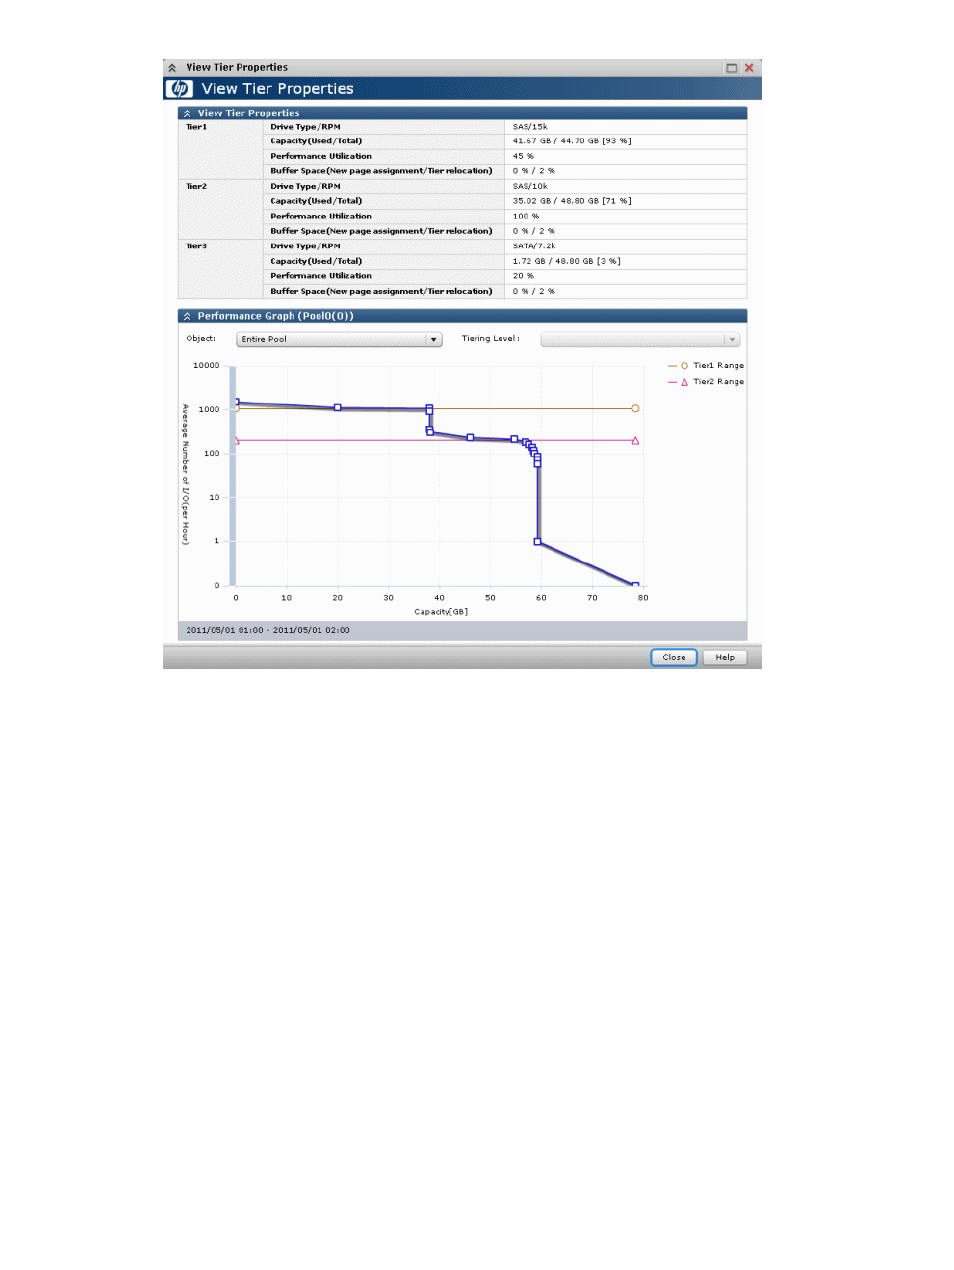
Monitoring mode settings (see
) of Period or Continuous influences the values shown
on the performance graph. Period mode will report the most recent completed monitor cycle
I/O data on the performance graph. Continuous mode will report a weighted average of I/O
data that uses recent monitor cycle data, along with historical data on the performance graph.
4.
Determine the tier range values
The page is allocated to the appropriate tier according to performance monitoring information.
The tier is determined as follows.
1.
Determine the tier boundary
The tier range value of a tier is calculated using the frequency distribution graph. This
acts as a boundary value that separates tiers
The pages of higher I/O load are allocated to the upper tier in sequence. Tier range is
defined as the lowest I/Os per hour (IOPH) value at which the total number of stored
pages matches the capacity of the target tier (less some buffer percentage) or the IOPH
value that will reach the maximum I/O load that the tier should process. The maximum
I/O load that should be targeted to a tier is the limit performance value, and the rate of
I/O to the limit performance value of a tier is called the performance utilization percent.
84
Configuring thin provisioning