Understanding the adaptive optimization statistics – HP LeftHand P4000 SAN Solutions User Manual
Page 224
Understanding the Adaptive Optimization statistics
You can select the Adaptive Optimization statistics that you wish to monitor. The Adaptive
Optimization Monitor reports individual storage system statistics. The Performance Monitor by
default reports cluster statistics. As you compare statistics across the monitoring tools, be aware
that the results may differ because of the different elements being reported on.
For example, if you look in the Performance Monitor at the cluster statistic ‘IOPS Writes,’ you will
see the number of write IOPs to the cluster. If the volume that is being written to has a data protection
level of Network RAID-10, you see only one write to the cluster, even though the LeftHand OS
replicates that write to another storage system based on the Network RAID level. In this case, the
cluster experiences a write to each storage system, but reports only the host-view write.
Now, let’s say you wanted to get the cluster-level IOPs write statistic for the Adaptive Optimization
writes. Since Adaptive Optimization monitoring is reporting the behavior of each storage system,
you must export all the storage system write IOPs (for all tiers) to a spreadsheet and then sum the
write IOPs. The sum of the Adaptive Optimization write IOPs shows the total IOPs that the LeftHand
OS is doing, which includes the write to each storage system, based on Network RAID-10. The
Adaptive Optimization monitor write IOPs total is twice the number of write IOPs that you would
see in the Performance Monitor when it reports the cluster-level write IOPs.
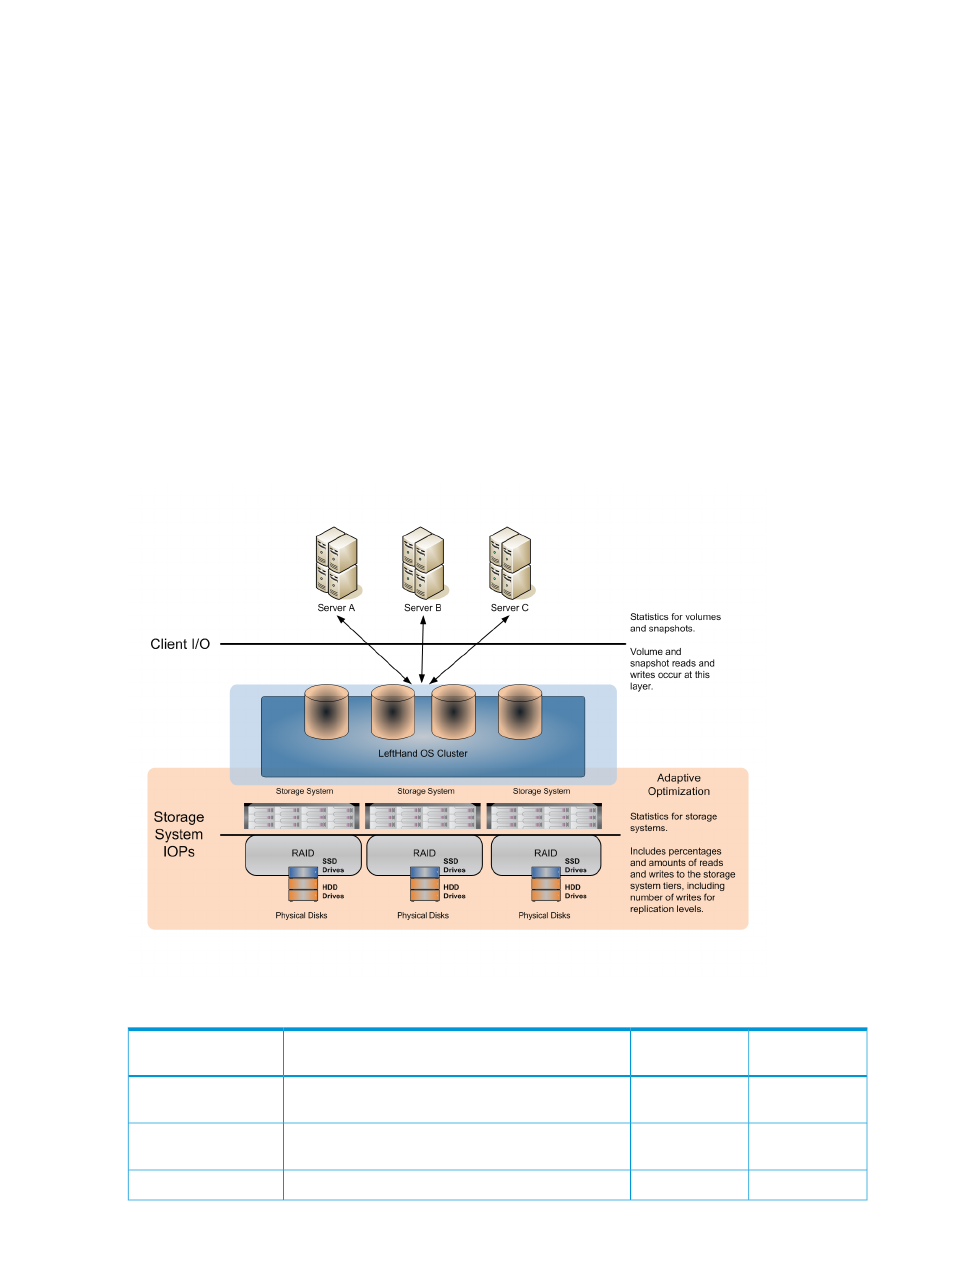
Figure 113 Adaptive Optimization statistics and where they are measured
Table 73 Adaptive Optimization statistics
Storage System
Volume or
Snapshot
Definition
Statistics
X
Total amount of space in use on the selected storage
system
Space All Tiers Used
X
Percent of the total amount of space in use on the
selected storage system
Space All Tiers Used
Percent
X
X
Percent of all read operations that are from Tier 0
Tier 0 IO Reads Percent
224 Monitoring performance