Monitoring the san, Current san activities example, Workload characterization example – HP LeftHand P4000 SAN Solutions User Manual
Page 213

Adaptive Optimization automatically places data on different types of storage devices based on
how often the data is accessed from the client application. These types of storage devices are
known as tiers and have different speeds and costs. Adaptive Optimization is patented technology
that detects the most frequently accessed data and, in nearly real time, migrates it to the higher
rated tier, moving the least accessed data to slower, potentially less expensive disk storage.
Adaptive Optimization adapts to changing workloads, re-balancing storage to optimize the
performance of a new workload. Each storage system performs this re-provisioning independently,
based on its own workload.
The following sections offer some ideas about using the available statistics to help you manage
your SAN effectively. These sections cover just a few examples of common questions and issues,
but they are not an exhaustive discussion of the possibilities the Performance Monitor offers.
For general concepts related to performance monitoring and analysis, see
and analysis concepts” (page 223)
.
Monitoring the SAN
Generally, the Performance Monitor can help you determine the following information.
•
Current SAN activities
What kind of load is the SAN under right now?
◦
◦
How much more load can be added to an existing cluster?
•
Workload characterization
◦
What is the impact of my nightly backups on the SAN?
•
Fault isolation
◦
I think the SAN is idle, but I see the drive lights blinking a lot. What is causing that?
Current SAN activities example
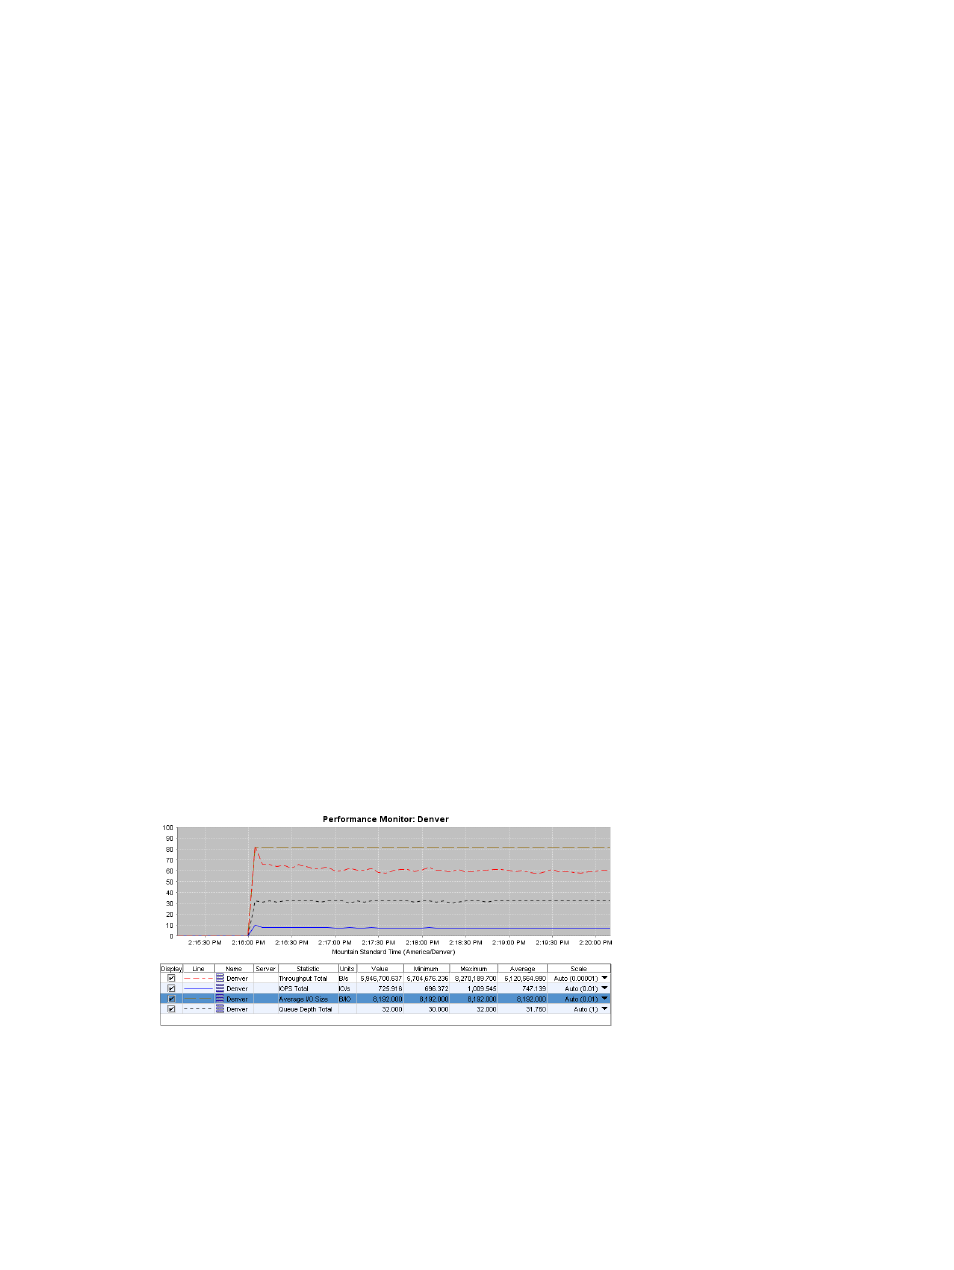
This example shows that the Denver cluster is handling an average of more than 747 IOPS with
an average throughput of more than 6 million bytes per second and an average queue depth of
31.76.
Figure 98 Example showing overview of cluster activity
Workload characterization example
This example lets you analyze the workload generated by a server (ExchServer-1) including IOPS
reads, writes, and total and the average IO size.
Monitoring the SAN
213
