Konica Minolta Polygon Editing Tool User Manual
Page 46
44
Chapter
2
File
Menu
9i
File – Import – Digitizer – Step Scan (When VIVID 9i is Selected)
9
Place the Calibration Chart on the ro-
tating stage and scan the Calibration
Chart.
Position the chart with the black line facing
the VIVID, and place it on the rotating stage so
that both entire side surfaces are observed in
the viewfinder.
M
emo
If it is not possible to perform calibration using calibra-
tion chart S, use calibration chart M.
• This step is not necessary if the Calibration Chart
data has already been imported when this dialog
box is opened.
• To acquire data from the object first then acquire
the calibration chart data, perform steps 9 and 10
after completing step 15. In this case, select cur-
rent chart angle from [Current Angle] and click
[Scan] button, or click [Chart Scan] button to
acquire chart data.
• The [Chart Scan] button appears when “Free”
is selected for [Rotation Step] in [File-Import-
Digitizer-One Scan-Option] dialog box.
• Steps 9 and 10 are not necessary when importing
existing the Calibration Chart data (i.e. data that
has coordinate parameters). Clicking the [Import
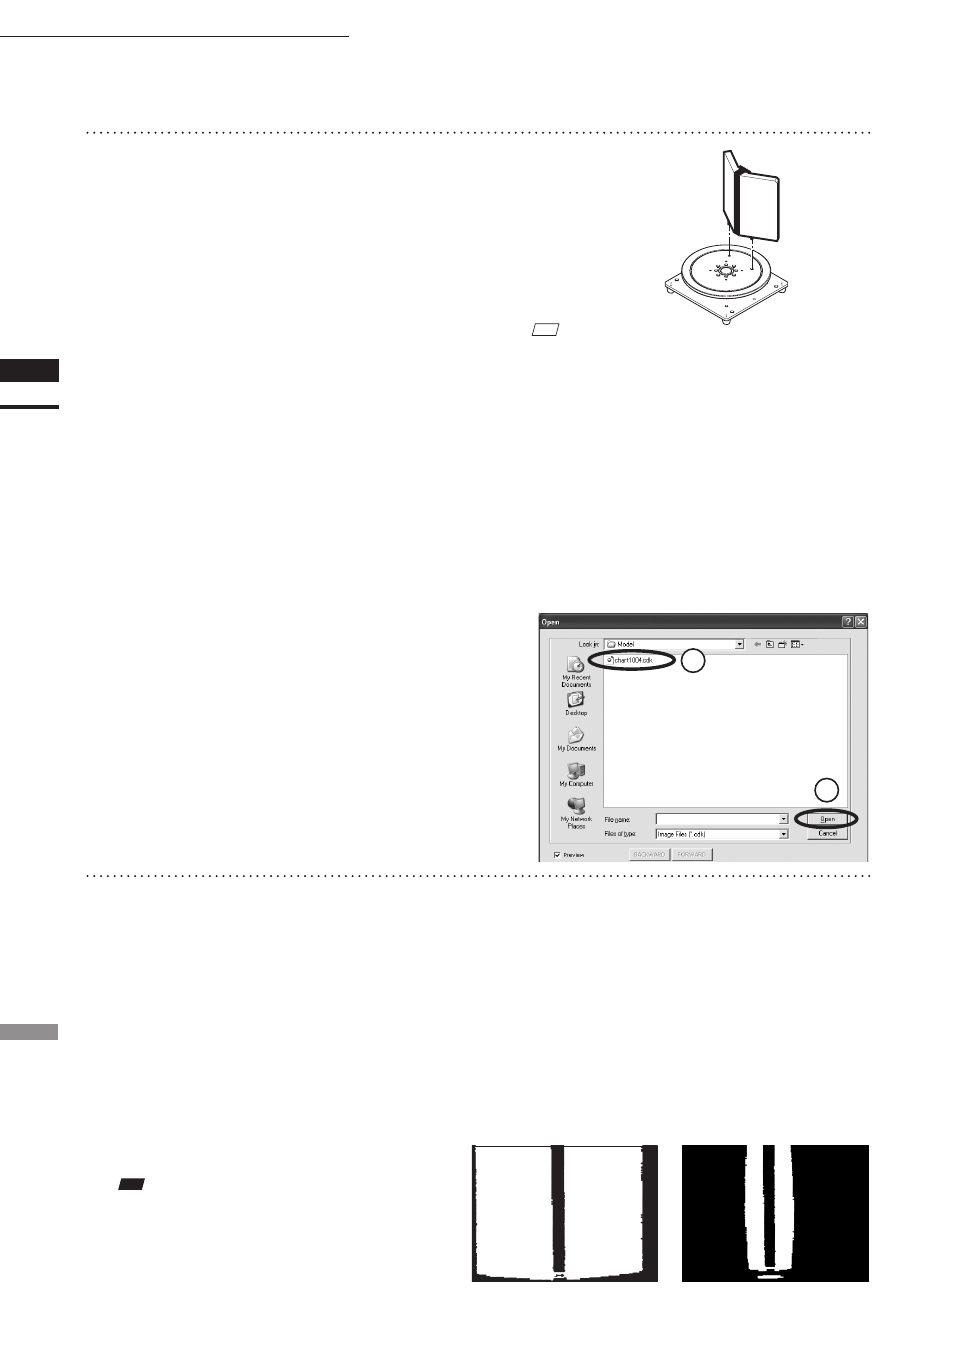
CDK] button will open the file read dialog box.
The Calibration Chart data (chart****.cdk) that
has been saved can be imported.
q
Select the file to be imported.
w
Click on the [Open] button.
10
Click the [Scan] button.
The Calibration Chart will be scanned.
When the data is recognized as Calibration
Chart data successfully:
q
The Calibration Chart data will be stored under
the file name of chart****.cdk (“****” are the
last four digits of the main unit’s serial num-
ber) in the Model folder.
w
The data acquired from the subsequent scans
will be coordinate-converted around the rota-
tional axis.
e
The [AutoScan] checkbox will be displayed.
• An error message will be displayed if the data is
not recognized as the Calibration Chart data suc-
cessfully.
• When “Free” has been selected using the [Rota-
tion Step] of the [Stage Parameter], please use the
[Chart Scan] button instead of the [Scan] button.
Note
Make sure that the acquired range image looks like
the good example given below. If it resembles the bad
example, click the [Scan] button again to re-scan the
calibration chart.
Calibration chart S
Good example
Bad example
1
2