Changing the display range – Measurement Computing eZ-PostView rev.2.0 User Manual
Page 30
eZ-PostView
08-30-022
Interactive Plot Display 3-5
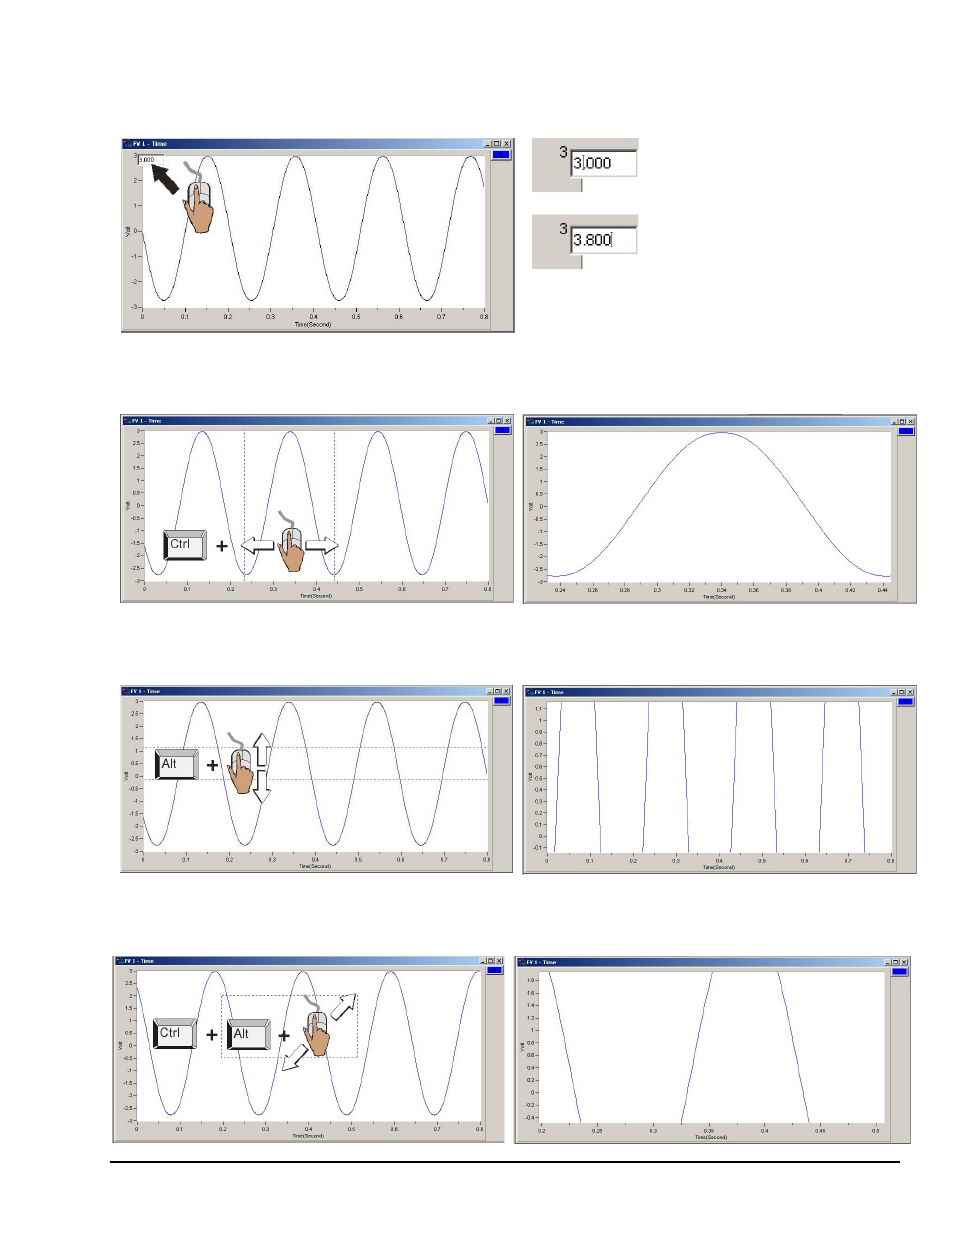
Changing the Display Range
To change the maximum or minimum range value: Left-click on upper or lower scale value that is to be changed, then
enter the new value. An example follows.
To change the X-Axis: Hold down the
the plot. Two vertical cursor lines will define the new x-axis end points.
To change the Y-Axis: Hold down the
plot. Two horizontal cursor lines will define the new Y-axis end-points.
To simultaneously change the X & Y Axes: Hold down the
the mouse cursor diagonally on the plot. A rectangle will define the new area of the plot.
In this example, the cursor and PC
keyboard were used to change the
maximum scale value from 3.000 volts
to 3.800 volts.
- ACC-300 (7 pages)
- AI-EXP32 (20 pages)
- AI-EXP48 (19 pages)
- BTH-1208LS (30 pages)
- 6K-ERB08 (32 pages)
- BTH-1208LS Quick Start (4 pages)
- 6K-SSR-RACK08 (33 pages)
- BTH-1208LS-OEM (27 pages)
- CB-COM-Digital (68 pages)
- CB-7018 (68 pages)
- CB-7000 Utilities (44 pages)
- CB-7080D (74 pages)
- CB-COM-7033 (44 pages)
- CB-COM-7017 (72 pages)
- CB-COM-7024 (76 pages)
- CB-NAP-7000P (36 pages)
- CIO-DAC02/16 (16 pages)
- CIO-DAC02 (18 pages)
- CB-NAP-7000D (56 pages)
- CIO-DAC16-I (16 pages)
- CIO-DAC16/16 (20 pages)
- CIO-DAS08 (21 pages)
- CIO-DAC16 (20 pages)
- CIO-DAS08/JR (16 pages)
- CIO-DAS08/JR/16 (14 pages)
- CIO-DAS08/JR-AO (16 pages)
- CIO-DAS08-AOM (32 pages)
- CIO-DAS08-PGM (28 pages)
- CIO-DAS16/330 (34 pages)
- CIO-DAS48-I (17 pages)
- CIO-DAS16/M1 (38 pages)
- CIO-DAS48-PGA (18 pages)
- CIO-DAS800 (20 pages)
- CIO-DAS802/16 (22 pages)
- CIO-DAS6402/16 (40 pages)
- CIO-DAS-TEMP (20 pages)
- CIO-DDA06/16 (18 pages)
- CIO-DDA06/JR (17 pages)
- CIO-DIO24H (20 pages)
- CIO-DIO24/CTR3 (21 pages)
- CIO-DI192 (24 pages)
- CIO-DDA06 (21 pages)
- CIO-DIO48 (19 pages)
- CIO-DO192H (16 pages)
- CIO-DIO192 (20 pages)