Measurement Computing eZ-PostView rev.2.0 User Manual
Page 127
eZ-Analyst
969895
Interactive Plot Display 5-9
Function
Description / Comments
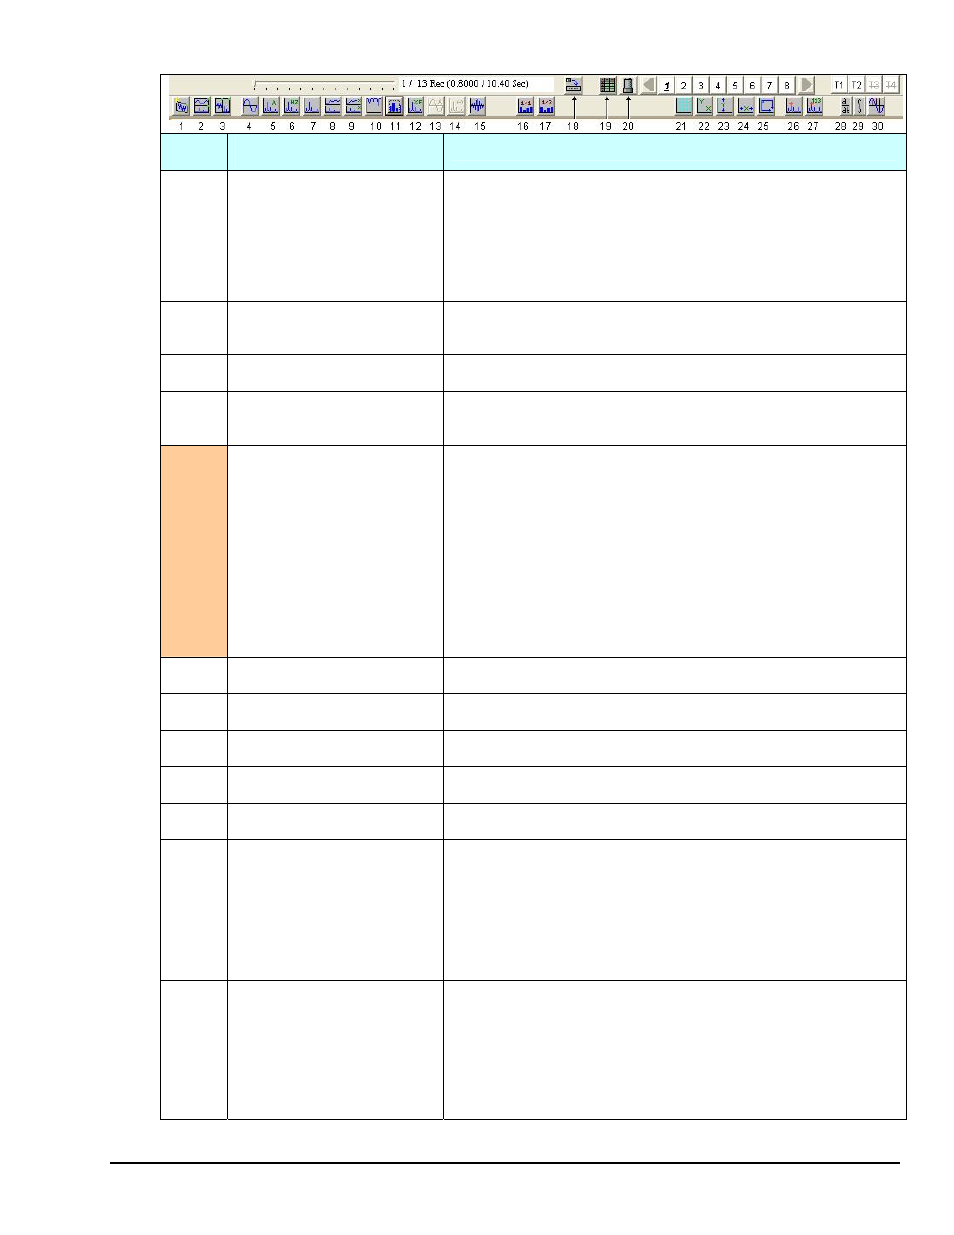
17
1/3 Octave
Extends from a lower frequency ( f0/2) to 32 times the lower
frequency (32 f0). The Octave (one-third octave) band
sound-pressure level is the integrated sound-pressure level of
all spectral components in the specified octave or one-third
octave band. The <1/3 Octave> button is only active when
the
18
Graph Toolbar
Opens [or closes] the graph toolbar, which consists of buttons
1 through 17 and buttons 21 through 30.
19
Edit Configuration
Opens the Configuration Settings window.
20
Input Channels Button
Open: makes a floating window of channel buttons. Closed:
keeps the buttons on the toolbar.
n/a
Strip Charts
There is no toolbar button for Strip Chart. To add a Strip
Chart:
(a) Go to the Plots menu-bar and open the Window pull-
down menu.
(b) Select the “Add Strip Chart” option.
For detailed information refer to the upcoming subsection
21
XY Axis Grids
Used to add or remove vertical and horizontal grid lines.
22
Auto Scale XY Axis
Lets the application automatically adjust the X and Y axis.
23
Manually Scale Y Axis
Lets the user manually adjust the Y-axis.
24
Manually Scale X Axis
Lets the user manually adjust the X-axis.
25
Manually Scale X & Y Axis
Lets the user manually adjust both the X and Y-axis.
26
Cursors
Cycles through the following cursor options: Cursor Off, Single
Cursor, Dual (Band) Cursor, Harmonic, SideBand, Peak,
FreeForm. Use the Amnotation button (#27) to view X and Y
values associated with the cursors.
For detailed information refer to
27
Annotation
Provides a means of displaying cursor values in terms of x and
y. Annotation can be displayed as numbers at the cursor or in
a frame, which includes forward and backward scrolling
arrows. Note that the annotation color will match the
“Foreground” color as set in Edit/Display Preferences. Note
that the Annotation frame will only display up to 6
sets of cursor values.