Measurement Computing eZ-PostView rev.2.0 User Manual
Page 136
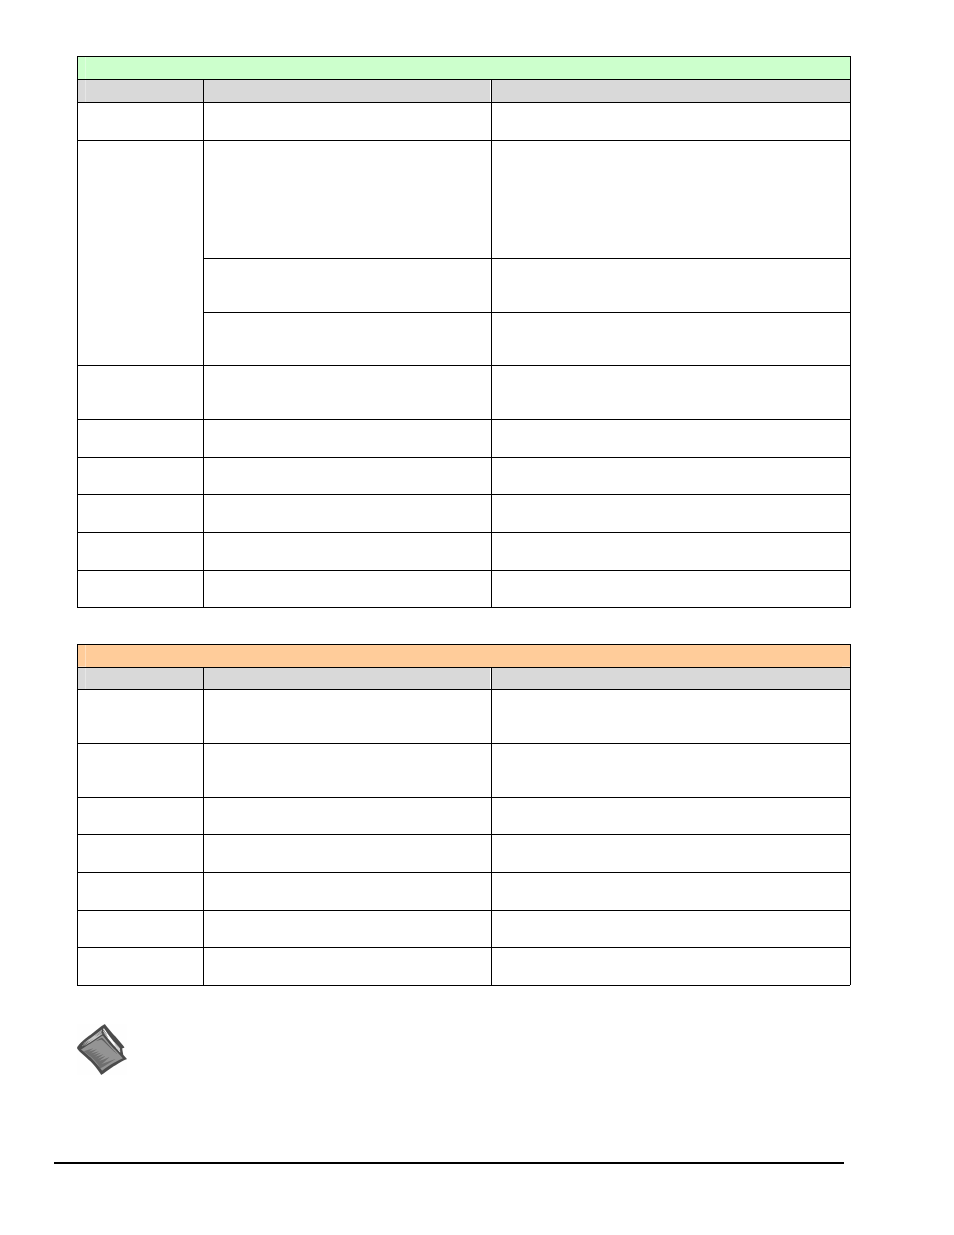
A-2 Keyboard Controls
957595
Appendix A
Display Menu Control
Keys
Function
Comments
D
Opens the Plot Display Character-
istics Menu
Option: “Right-clicking” the mouse, while the
cursor is over the plot will also open this menu.
Used to open the Complex Type
Display Menu.
This option is only available when a
function with complex data is displayed.
Menu choices are: Magnitude, Phase,
Real, Imaginary, Magnitude + Phase,
Real + Imaginary, and Nyquist
Press D + C; release, then press
Complex Type Display Menu will open. Use the
arrow keys to highlight the type of display, then
press
Used to open the Copy Menu.
Menu choices are: Data, Plot Window,
Screen.
Press D + C; release, then use the arrow key to
select Copy. After selecting Copy, press
D + C
(3 functions)
Used to open the Cursor Menu.
Menu choices are: Single Cursor,
Band Cursor, or Cursor Off.
Press D + C; release, then use the arrow key to
select Cursor. After selecting Cursor press
D + F
Opens the Display Functions Menu.
Note that right-clicking on the plot will
also open this menu.
Use arrow keys to highlight your selection, then
press
first letter of an option to select it.
D + I
Opens the
Integration/Differentiation Menu.
Use arrow keys to highlight your selection, then
press
D + L
Opens the Label / List Menu.
Use arrow keys to highlight your selection, then
press
D + O
Opens the Octave Menu.
Use arrow keys to highlight your selection, then
press
D + S
Opens the Scale Type Menu.
Menu choices are RMS, Peak, Pk-Pk.
Use arrow keys to highlight your selection, then
press
D + T
Opens the Transfer Type Menu.
Use arrow keys to highlight your selection, then
press
Plot Display Controls (Note)
Keys
Function
Comments
Mouse-Click
Bottom Border
Change the X-axis in regard to format,
scale, and grid.
Right-click on the plot’s bottom border to access a
menu for changing the X-axis in regard to Format,
Scale, and Grid.
Mouse-Click
Left Border
Change the Y-axis in regard to format,
scale, and grid.
Right-click on the plot’s left border to access a
menu for changing the Y-axis in regard to Format,
Scale, and Grid.
,
Moves the primary cursor left along the
trace.
When in Band Cursor mode, the comma moves the
primary cursor to the left.
.
Moves the primary cursor right along
the trace.
When in Band Cursor mode, the period moves the
primary cursor to the right.
<
Moves the secondary cursor left along
the trace.
When in Band Cursor mode, the “<” moves the
secondary cursor to the left.
>
Moves the secondary cursor right along
the trace.
When in Band Cursor mode, the “>” moves the
secondary cursor to the right.
Peak search.
Press the
mouse button to search for peaks along the trace.
Note: Also see the Display Menu Control Table. Continued
Reference Note: For more detailed information, which includes graphics, refer to
chapter 5, Interactive Features of the Plot Display Window
(continued)