Measurement Computing eZ-PostView rev.2.0 User Manual
Page 125

eZ-Analyst
969895
Interactive Plot Display 5-7
Function
Description / Comments
FRF
(button 8 continued)
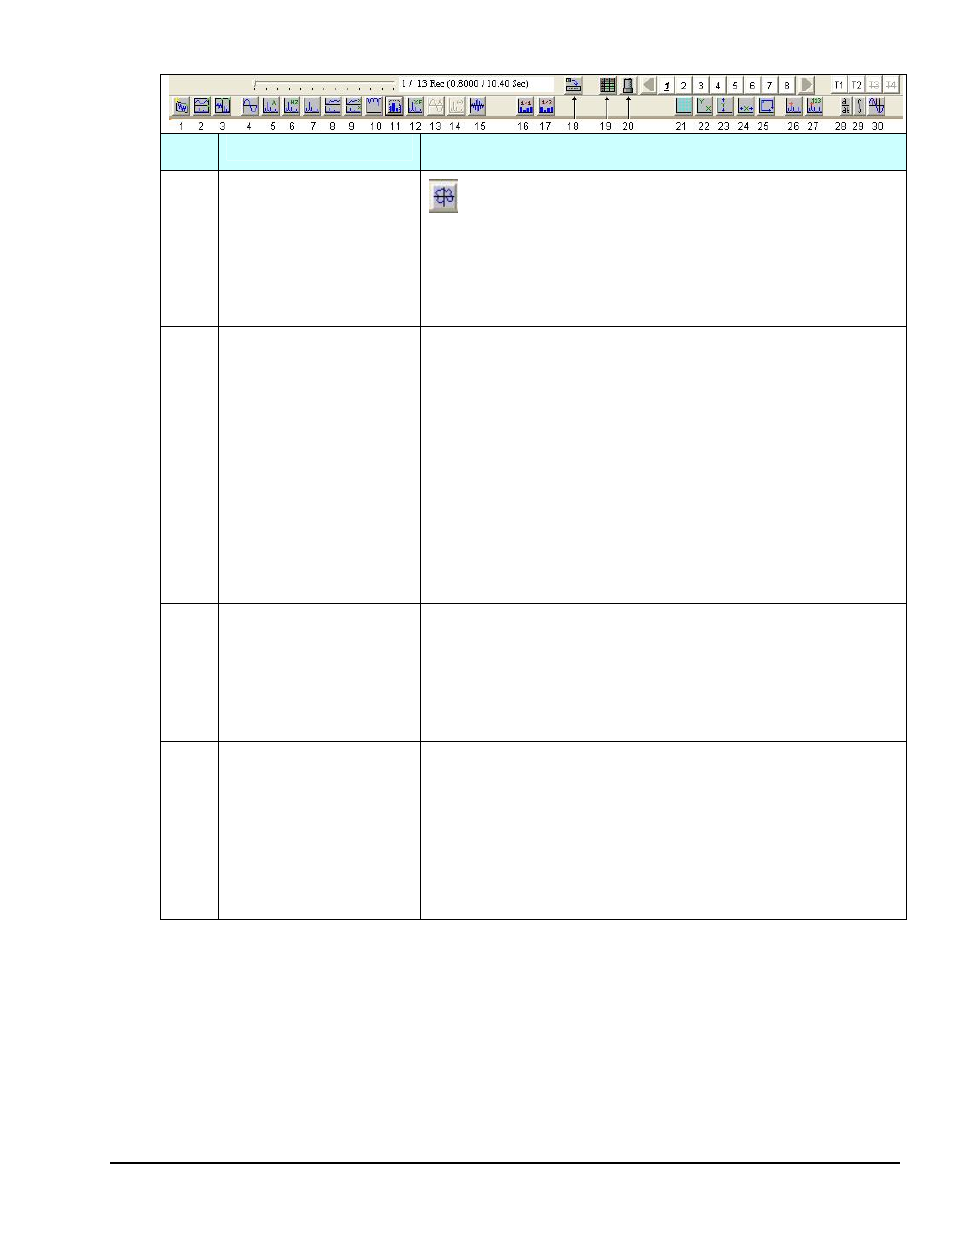
Nyquist: A Nyquist plot is another way to display real
and imaginary data. The real numbered data is
plotted on the X-axis and the imaginary numbered
data is plotted on the Y-axis with consecutive points
joined by line segments. From basic vibration theory,
a Nyquist plot of a mobility function should trace out a
circle (counter-clockwise) as the frequency is
increased through an isolated structural resonance.
9
Cross*
A dual-channel display function in the frequency domain. It is
equal to the product of the complex Fourier spectrum of y(t) (the
numerator or first named channel) times the complex conjugate
of the Fourier spectrum of x(t) (the denominator or second
named channel). The special case y=x yields the autospectrum.
Averaging of these functions (frequency-domain averaging) forms
the basic foundation on which virtually all other multichannel,
frequency-domain analysis is built. The cross spectrum is
calibrated in units of (peak EUy) (peak EUx).
When the Cross (#9) or FRF (#8) button is clicked on; then the
following buttons for more complex data displays become active.
The buttons will appear in the toolbar between buttons #15 and
# 21 and are briefly discussed in the FRF section (preceding row)
of this table.
10
Coherence*
A dual-channel display function. At each frequency, the
coherence is a value between 0.0 and 1.0, which indicates the
degree of consistent linear relationship between two signals
during the averaging process. A value of less than one indicates
that phase cancellation occurred during cross-spectrum
averaging, which may be due to uncorrelated noise on one or
both signals or to a nonlinear relationship between signals.
11
Octave*
Many sounds, including audible noise for a transmission line, are
broad band, having components that are continuously distributed
over a range of frequencies. The spectrum of such a sound can
be approximated in terms of a series of octave band or one-third
octave band pressure levels. A band is designated by its center
frequency, f0, which is the geometric mean of the upper and
lower frequencies of the band. (See ANSI/ASC S1.6-1984.) This
button activates two Octave Type buttons, i.e., Full Octave (#16)
and 1/3 Octave (#17).
* Buttons 9, 10, 11 will only be active if there is a “Reference Channel.” A channel can be selected
to “Reference” in the Input/Output Channels Tab via the Response/Reference column.
