Using the toolbar buttons, Using the toolbar buttons …… 5-6 – Measurement Computing eZ-PostView rev.2.0 User Manual
Page 124
5-6 Interactive Plot Display
969895
eZ-Analyst
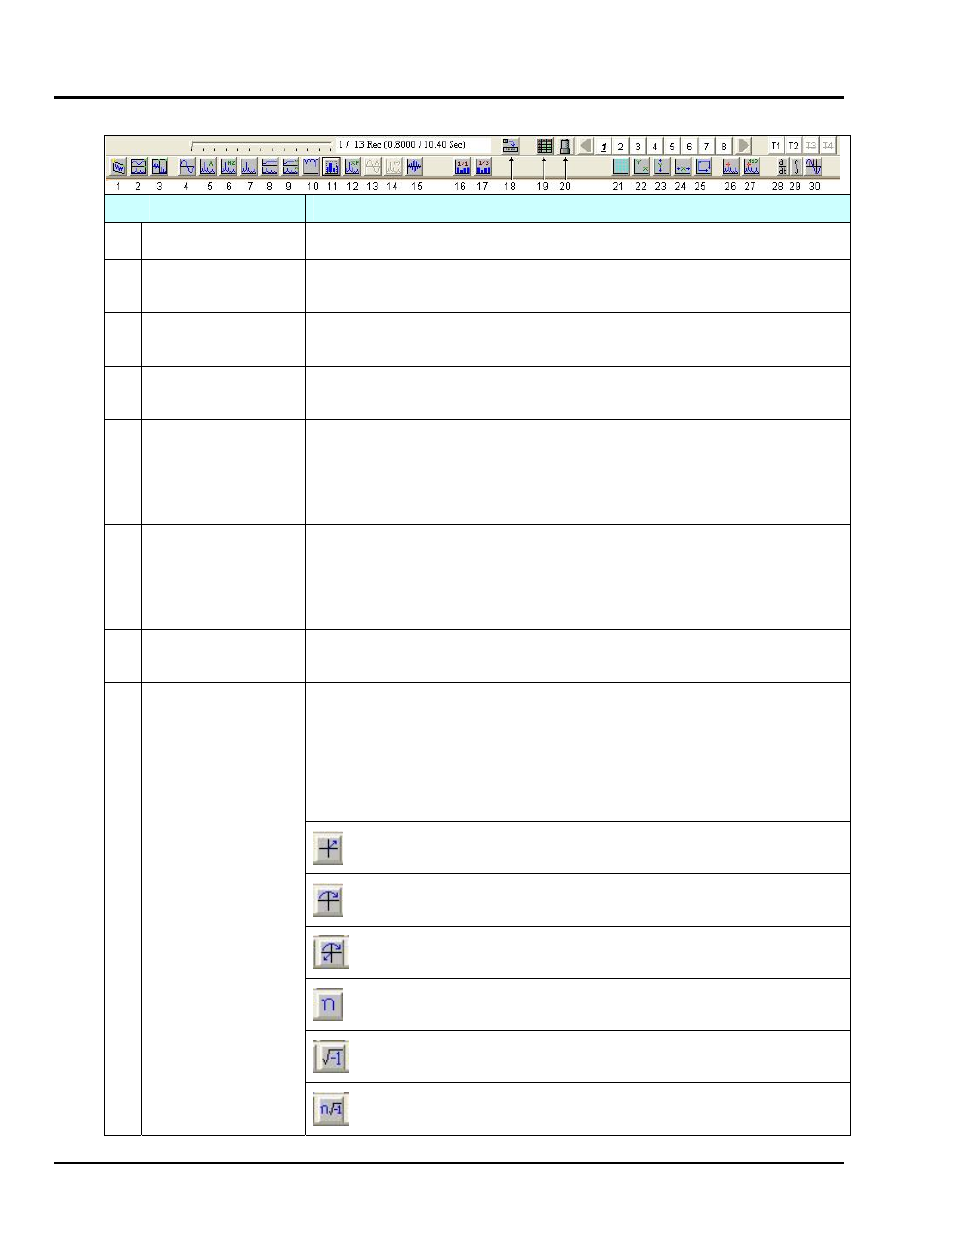
Using the Toolbar Buttons
Function
Description / Comments
1
Add New FV Window Adds a new Function View.
2
Tile Horizontally
Tiles two or more Function Views such that they are longer in the
horizontal direction.
3
Tile Vertically
Tiles two or more Function Views such that they are longer in the vertical
direction.
4
Time
A single-channel display function. Displays a time domain waveform of
filtered, sampled data scaled in either Volts or EUs.
5
Auto-Spectrum
A single-channel display function. Displays the square of the magnitude
of the complex (one-side) Fourier spectrum of x(t). Autospectra are
calibrated so that if A is the peak amplitude of a sinusoidal signal x(t),
then the autospectrum has the value A*A (or use A power 2) at the
sinusoidal frequency.
6 PSD
(Power Spectral
Density)
Power Spectral Density (PSD) displays the power of random vibration
intensity as “mean-square acceleration per frequency unit.” PSD is a
single-channel display function. It is the Fourier Transform of the Auto-
correlation function. This normalization should be used with continuous
random signals.
7
Spectrum
A dual-channel display function. Displays averaged linear spectrum
computed as the square root of the averaged autospectrum.
8
FRF
A dual-channel function for the single-input, single-output (SISO)
frequency response function between two specified input channels. FRF is
the averaged cross-spectrum divided by the averaged autospectrum of
the input (the second named channel). When the FRF (#8) or the Cross
(#9) button is clicked on; then the following buttons for more complex
data displays become active. These buttons, not shown in the above
figure, will appear in the toolbar between buttons #15 and # 21.
Magnitude: Plots only the magnitude of real or complex data.
Phase: Plots only the phase of complex data.
Magnitude and Phase: Plots both Magnitude and Phase data.
Real: Plots only the Real numbered data.
Imaginary
Real and Imaginary: Plots both Real and Imaginary data.