Rockwell Automation FactoryTalk Historian Classic User Guide User Manual
Page 78
Chapter 4 Analyzing FactoryTalk Historian Classic Data
6. in this Legend list. Select the three User Fields in the Fields in
this Legend list and use the arrow buttons to move these fields
up so that they immediately follow the Reporting Tag and
Units fields.
7. To display the relative time of each batch, repeat the same
procedure to add the Relative Time Start and Relative Time
End fields to the Authoring Legend. Use the arrow buttons to
position these fields after User Field 3.
8. Click OK to close the dialog box and display your chart.
9. Double-click the report object and make sure the Time
Selection toolbar is showing a date range that contains data for
the selected reporting tag. This step is important. If your chart
is not showing data, the Batch Prompt dialog box that will be
displayed in the next step will not show any batch prompt
fields. In this example, we can click the All Times button on
the Time Selection toolbar and then click the Refresh button
to display the line that represents the coffee temperature data.
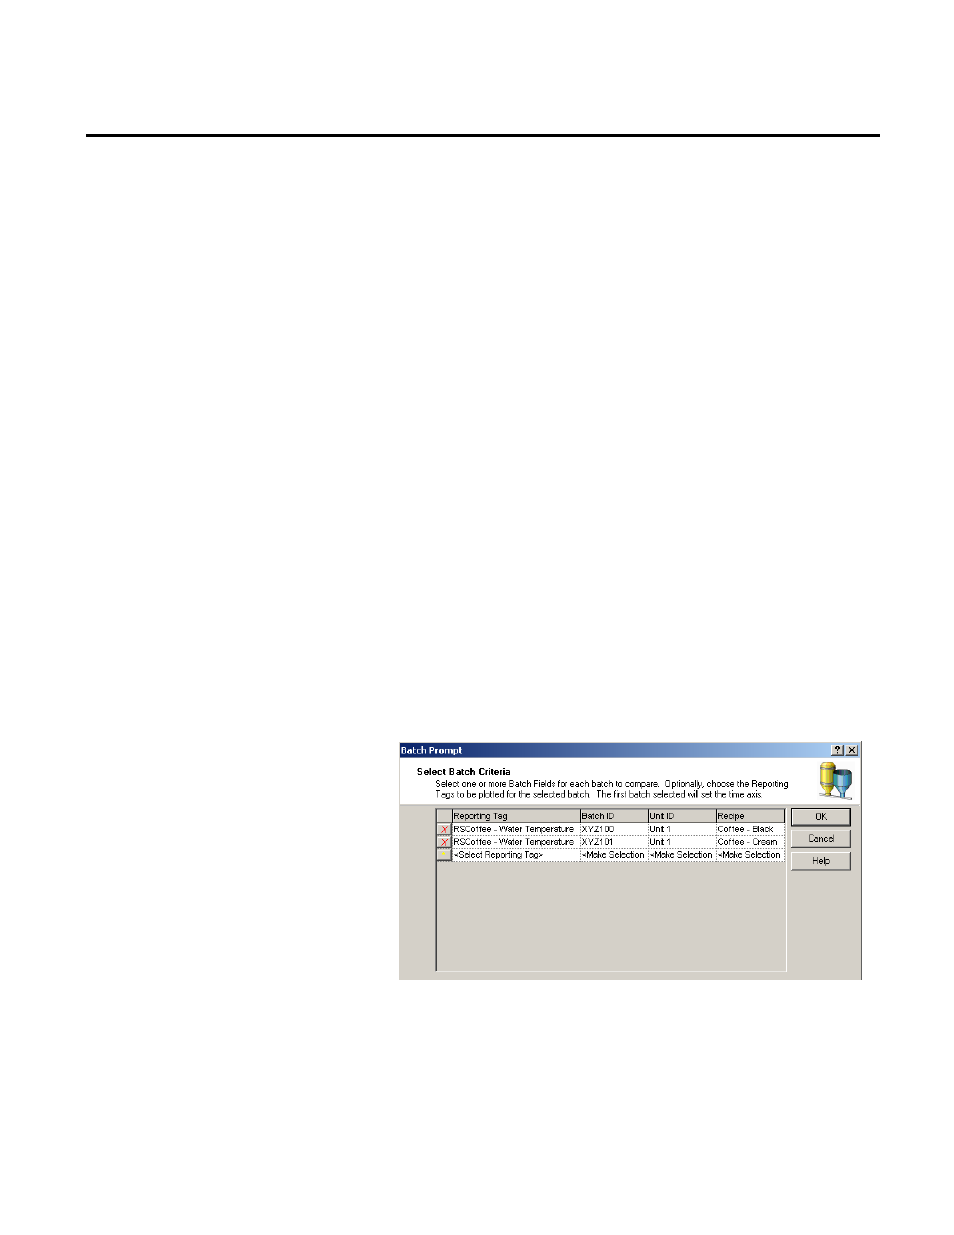
10. This dialog box allows you to select one or more batches for
which you want to compare data without the need to specify
the start time and end time for each batch.
In the first row of the Batch Prompt grid, select the Water
Temperature reporting tag from the list of reporting tags that
have been added to the chart. Using the subsequent fields,
select the batch parameters to identify the batch you would
like to display. For this tutorial, select XYZ100 from the
78
Rockwell Automation Publication HIST-UM001K-EN-E-June 2014