Step 9: remove a reporting tag or an analysis tool, Create a simple batch/event chart – Rockwell Automation FactoryTalk Historian Classic User Guide User Manual
Page 76
Chapter 4 Analyzing FactoryTalk Historian Classic Data
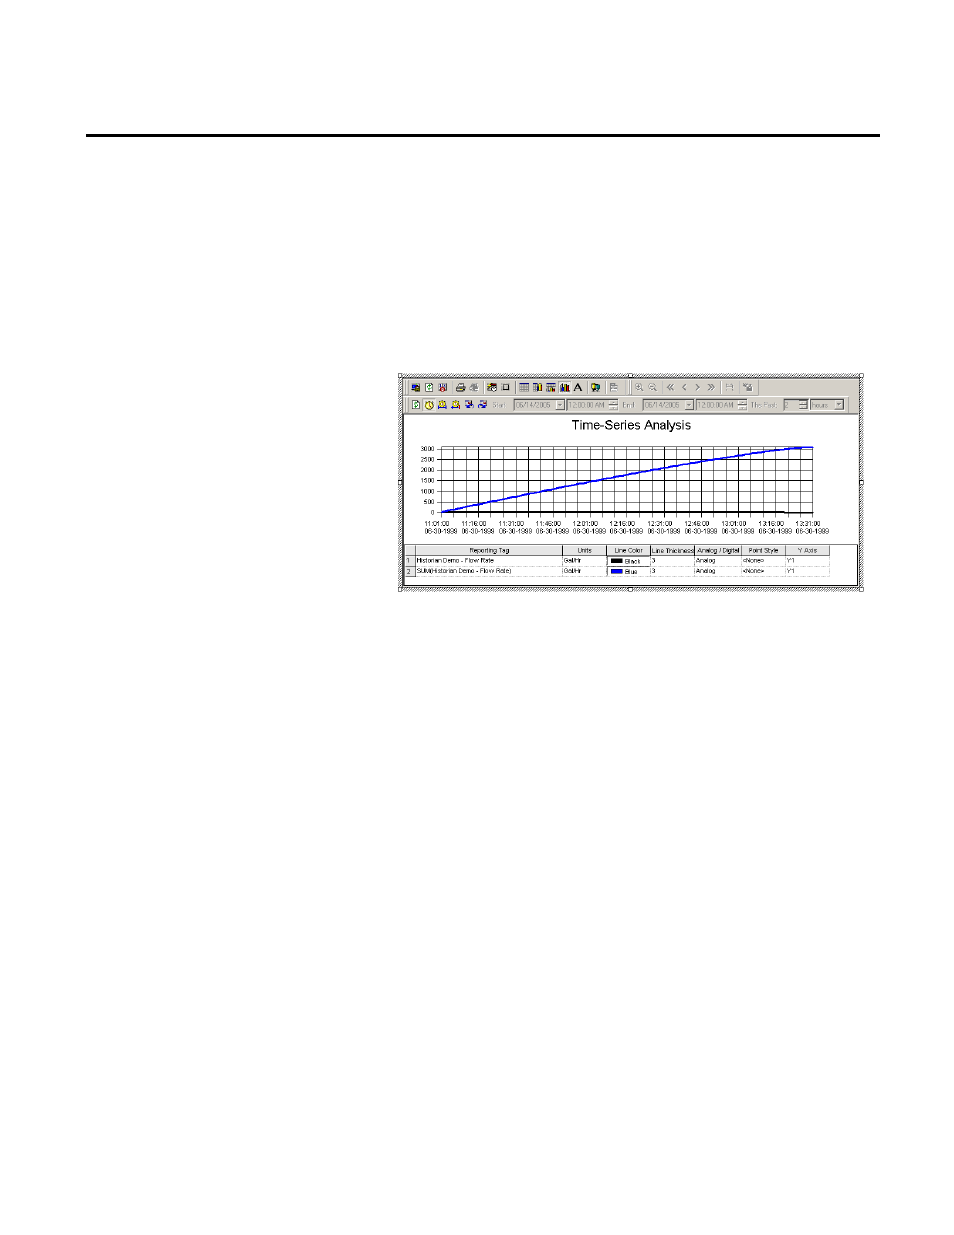
You will notice that the Y1 axis is shown to the left of the
chart and the Y2 axis is shown to the right of the chart and
that the value ranges for the two lines are very different. If you
had placed the SUM tool on the same Y-axis with the Flow
Rate, the large range of values for the SUM tool would have
distorted the FactoryTalk Historian Classic Demo – Flow
Rate line, making it appear deceptively flat, as shown below.
To remove a reporting tag or an analysis tool from your time-series
chart without opening the Configure Time-Series Report Object
dialog box, right-click the reporting tag (or analysis tool) in the
Authoring legend and select Remove Reporting Tag from the
shortcut menu that is displayed. The reporting tag or analysis tool is
removed from the chart and the chart is refreshed.
Let’s suppose that we are collecting the water temperature from a
process. The process allows the user to enter a Batch ID, specify the
kettle (or unit) in which to brew the coffee, and select a coffee
recipe. These batch parameters are collected from the control system
with FactoryTalk Transaction Manager transactions and are stored
in the BatchSummary table in the RSBizWare database.
We would like to be able to report on the water temperature from
the process by simply selecting one of these batch parameters, such as
the Batch ID that uniquely identifies the batch, rather than needing
to specify the start time and end time. Additionally, we would like to
be able to specify more than one batch to be displayed on the
Step 9: Remove a Reporting
Tag or an Analysis Tool
Create a Simple Batch/Event
Chart
76
Rockwell Automation Publication HIST-UM001K-EN-E-June 2014