Debugging custom analysis tools in visual c – Rockwell Automation FactoryTalk Historian Classic User Guide User Manual
Page 154
Chapter 7 Creating RSBizWare Custom Analysis Tools
If your custom analysis tool does not work in the Configuration
Console the first time, you may need to debug your
Calculate()
function. The easiest way to do this is to use the Visual C++
debugger when running the Configuration Console as follows:
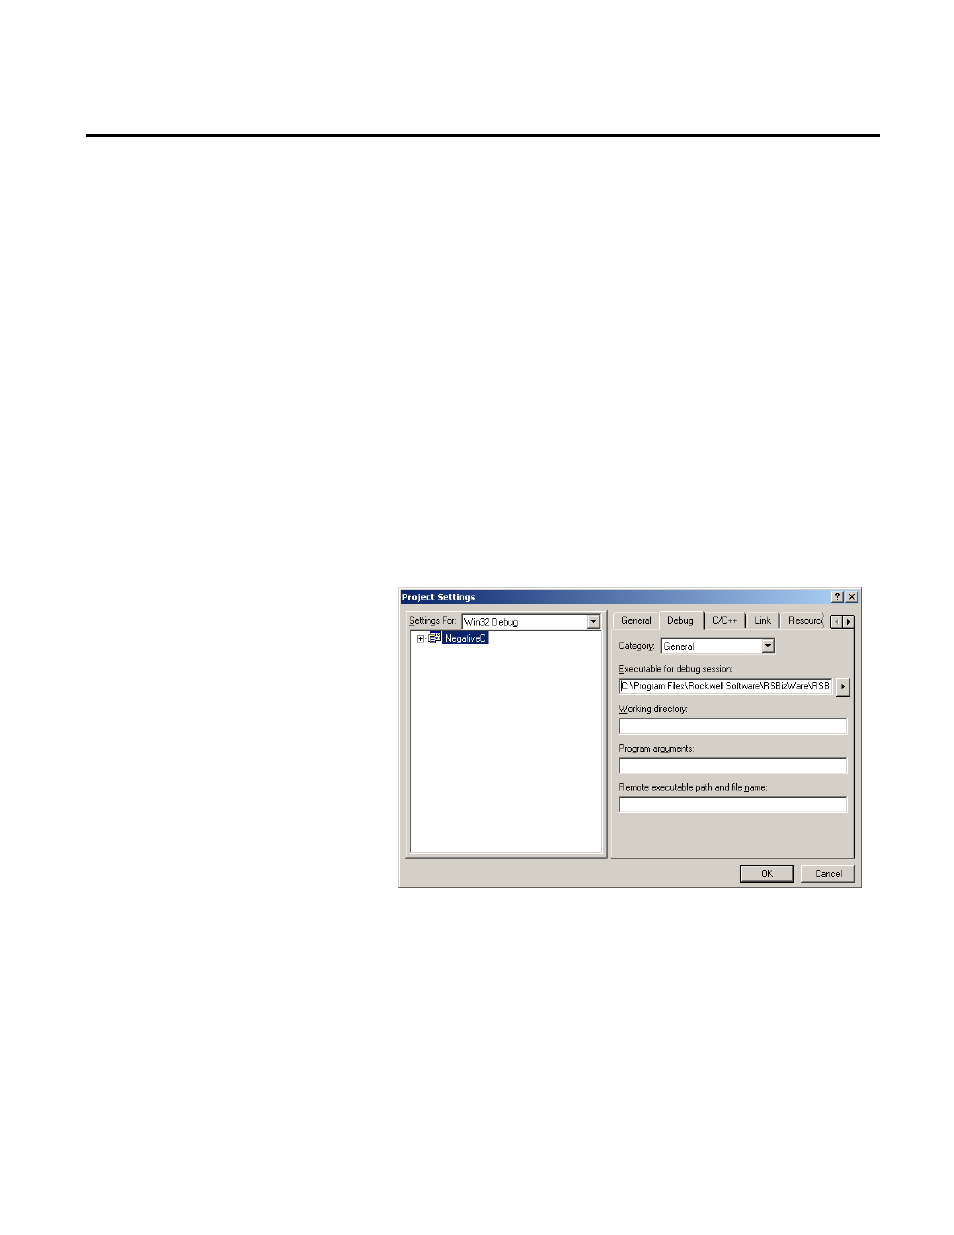
1. Select Project > Settings from the menu.
2. On the Project Settings dialog box shown below, select the
Debug tab. Make sure you have the Win32 Debug selected
from the Settings For list.
3. On the Executable for debug session box, click the arrow
button to browse and select the Configuration Console
executable (\Program Files\Rockwell
Software\RSBizWare\RSBizWare Production Client.exe).
4. Click OK to save your changes.
Now, when you debug the project, the Configuration Console will
be started. You then can set debug breakpoints in your
Calculate()
function. When you use your custom analysis tool in a time-series
chart, your breakpoints will be called in Visual C++. You can then
use the full power of the Visual C++ debugger to track down your
problem.
Debugging Custom Analysis
Tools in Visual C++
154
Rockwell Automation Publication HIST-UM001K-EN-E-June 2014
- 20P PowerFlex DC Drive - Frame D Bimetal Thermostat (10 pages)
- 1336S_F_T_E_R F Frame Snubber Resistor Repl. (6 pages)
- 22-COMM PowerFlex 4-Class DSI (Drive Serial Interface) Network Communication Adapter (4 pages)
- 8-545 Plug In Solid State Relay (2 pages)
- 20-HIM-B1 PowerFlex 7-Class HIM Bezel (DPI) (4 pages)
- 100 Contactors with DC Coil (2 pages)
- 100 Contactors with DC Coil (1 page)
- 20P PowerFlex DC Drive - Frame D Switching Power Supply Circuit Board (6 pages)
- 140G-MTFx_MTHx_MTIx_MTKx Trip Unit Installation-140G-M (6 pages)
- 45BRD Analog Laser Sensor (4 pages)
- 20D Multi-Device Interface Option Board for PowerFlex 700S Drives (20 pages)
- 56RF RFID 18 mm Cylindrical Transceiver (2 pages)
- 42KC Miniature Rectangular: 5V DC Version (2 pages)
- 20P PowerFlex DC Drive - Frame A Switching Power Supply Circuit Board (16 pages)
- 21P-MISC-A-TP-2 Transition Tube Kit #C19-6/7 For PowerFlex 755 w/OEM Liquid Cooling Fr 6/7 Drive (2 pages)
- 42BT Background Suppression Sensor (3 pages)
- 42CB High Speed 18mm Cylindrical (4 pages)
- 140EX-JE2_JE3 Molded Case Circuit Breaker (4 pages)
- 140G-K-EAM1A Early Make Aux Contact for Rotary Handle Oper Mech-140G-K (1 page)
- 140G-K-EAM1A Early Make Aux Contact for Rotary Handle Oper Mech-140G-K (3 pages)
- 20-HIM-A6 PowerFlex (Human Interface Module) (74 pages)
- 42CF General Purpose 12mm Cylindrical (4 pages)
- 20D PowerFlex 700S Phase II Drive Frames 1...6 (80 pages)
- 140EX-HE1_HE2 Molded Case Circuit Breaker (6 pages)
- 140EX-HE1_HE2 Molded Case Circuit Breaker (4 pages)
- 20B PowerFlex 700 Custom Firmware - Pump Off (12 pages)
- 20-WIM-N4S DPI Wireless Interface Module (92 pages)
- 140U H-Frame Circuit Breaker Fixed and Adjustable Thermal Trip (2 pages)
- 140U H-Frame Circuit Breaker Fixed and Adjustable Thermal Trip (7 pages)
- 60-2619, 42JS Swivel/Tilt Mounting Bracket (1 page)
- 22A PowerFlex 4/40/400 Flange Mount (4 pages)
- 45MLA Controller Installation Instructions (16 pages)
- 20P PowerFlex DC Drive - Cooling Fan for Frame A Drives Above 73A at 230V 460V AC (6 pages)
- 42JS Series 7000 to 42JS VisiSight Replacement Kit (2 pages)
- 22A PowerFlex 4-Class HIM Bezel (DSI) (4 pages)
- 42CS Stainless Steel Photoelectric Sensors (4 pages)
- 20L-LL PowerFlex 700L Liquid-to-Liquid Heat Exchanger (40 pages)
- 20P PowerFlex DC Drive - Frame B SCR Modules (20 pages)
- 22B PowerFlex 40 Quick Start FRN 5.xx - 6.xx (161 pages)
- 22B PowerFlex 40 Quick Start FRN 5.xx - 6.xx (22 pages)
- 22F PowerFlex 4M Input RFI Filters (2 pages)
- 45LFM Capacitive Label Sensor (4 pages)
- 140G-Rx Installation Instruction-140G-R (2 pages)
- 140G-Rx Installation Instruction-140G-R (29 pages)
- 22C PowerFlex 400 AC Drive Quick Start - FRN 1-4.xx (28 pages)