Create a new text report object – Rockwell Automation FactoryTalk Historian Classic User Guide User Manual
Page 60
Chapter 4 Analyzing FactoryTalk Historian Classic Data
6. For this tutorial, hold down the Ctrl key on your keyboard
and select all of the Injection Molding data points from the
list.
7. Click OK to display the chart with the data points that you
selected.
Refer to "Customizing RSBizWare Charts and Tables (page 87)" for
information on how to further customize your chart by changing the
title or bar/line colors.
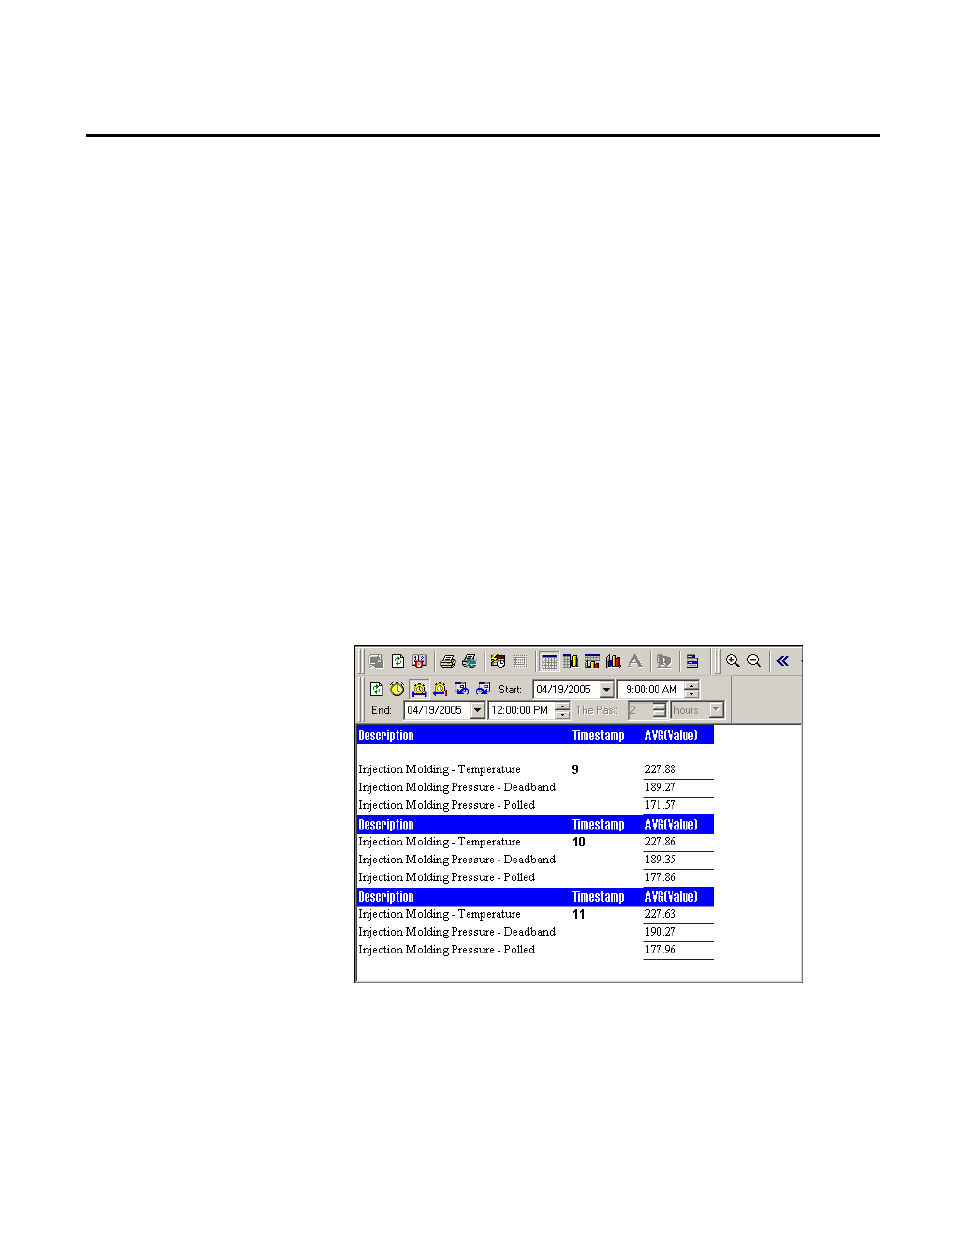
The Configuration Console gives you the ability to create a text
report object (or table) on your report that displays the data from a
report data source. The purpose of this tutorial is to walk through
the steps that are necessary to create a table in your report. For this
tutorial, you will use the Historian Data Point View report data
source to create a table showing the average value for data points.
Your table will look similar to the one shown below.
Create a New Text Report
Object
60
Rockwell Automation Publication HIST-UM001K-EN-E-June 2014
- 20P PowerFlex DC Drive - Frame D Bimetal Thermostat (10 pages)
- 1336S_F_T_E_R F Frame Snubber Resistor Repl. (6 pages)
- 22-COMM PowerFlex 4-Class DSI (Drive Serial Interface) Network Communication Adapter (4 pages)
- 8-545 Plug In Solid State Relay (2 pages)
- 20-HIM-B1 PowerFlex 7-Class HIM Bezel (DPI) (4 pages)
- 100 Contactors with DC Coil (2 pages)
- 100 Contactors with DC Coil (1 page)
- 20P PowerFlex DC Drive - Frame D Switching Power Supply Circuit Board (6 pages)
- 140G-MTFx_MTHx_MTIx_MTKx Trip Unit Installation-140G-M (6 pages)
- 45BRD Analog Laser Sensor (4 pages)
- 20D Multi-Device Interface Option Board for PowerFlex 700S Drives (20 pages)
- 56RF RFID 18 mm Cylindrical Transceiver (2 pages)
- 42KC Miniature Rectangular: 5V DC Version (2 pages)
- 20P PowerFlex DC Drive - Frame A Switching Power Supply Circuit Board (16 pages)
- 21P-MISC-A-TP-2 Transition Tube Kit #C19-6/7 For PowerFlex 755 w/OEM Liquid Cooling Fr 6/7 Drive (2 pages)
- 42BT Background Suppression Sensor (3 pages)
- 42CB High Speed 18mm Cylindrical (4 pages)
- 140EX-JE2_JE3 Molded Case Circuit Breaker (4 pages)
- 140G-K-EAM1A Early Make Aux Contact for Rotary Handle Oper Mech-140G-K (1 page)
- 140G-K-EAM1A Early Make Aux Contact for Rotary Handle Oper Mech-140G-K (3 pages)
- 20-HIM-A6 PowerFlex (Human Interface Module) (74 pages)
- 42CF General Purpose 12mm Cylindrical (4 pages)
- 20D PowerFlex 700S Phase II Drive Frames 1...6 (80 pages)
- 140EX-HE1_HE2 Molded Case Circuit Breaker (6 pages)
- 140EX-HE1_HE2 Molded Case Circuit Breaker (4 pages)
- 20B PowerFlex 700 Custom Firmware - Pump Off (12 pages)
- 20-WIM-N4S DPI Wireless Interface Module (92 pages)
- 140U H-Frame Circuit Breaker Fixed and Adjustable Thermal Trip (2 pages)
- 140U H-Frame Circuit Breaker Fixed and Adjustable Thermal Trip (7 pages)
- 60-2619, 42JS Swivel/Tilt Mounting Bracket (1 page)
- 22A PowerFlex 4/40/400 Flange Mount (4 pages)
- 45MLA Controller Installation Instructions (16 pages)
- 20P PowerFlex DC Drive - Cooling Fan for Frame A Drives Above 73A at 230V 460V AC (6 pages)
- 42JS Series 7000 to 42JS VisiSight Replacement Kit (2 pages)
- 22A PowerFlex 4-Class HIM Bezel (DSI) (4 pages)
- 42CS Stainless Steel Photoelectric Sensors (4 pages)
- 20L-LL PowerFlex 700L Liquid-to-Liquid Heat Exchanger (40 pages)
- 20P PowerFlex DC Drive - Frame B SCR Modules (20 pages)
- 22B PowerFlex 40 Quick Start FRN 5.xx - 6.xx (161 pages)
- 22B PowerFlex 40 Quick Start FRN 5.xx - 6.xx (22 pages)
- 22F PowerFlex 4M Input RFI Filters (2 pages)
- 45LFM Capacitive Label Sensor (4 pages)
- 140G-Rx Installation Instruction-140G-R (2 pages)
- 140G-Rx Installation Instruction-140G-R (29 pages)
- 22C PowerFlex 400 AC Drive Quick Start - FRN 1-4.xx (28 pages)