Step 9: insert your new chart into the report – Rockwell Automation FactoryTalk Historian Classic User Guide User Manual
Page 59
Analyzing FactoryTalk Historian Classic Data Chapter 4
Now that you have selected the report data source, created the chart
report object, and created a prompt-at-runtime filter, you are ready
to insert the chart into the report.
To insert the chart into the report:
1. Click Finish to add the chart to the report. The chart is shown
as a simple box outline.
2. To ensure that the filter is properly associated with the report
object, right-click the report object and select Properties.
3. In the Report Object Properties dialog box, select the
Runtime Settings tab and select the Data Point Filter from
the Default Filter list.
4. Click OK to return to the report object.
5. Double-click inside the box outline to see the chart,.
Click the All Time Range button
on the Time Selection
toolbar, set the time range to 4/19/2005 9:00 AM to
4/19/2005 12:00 PM, and click Refresh. When you refresh a
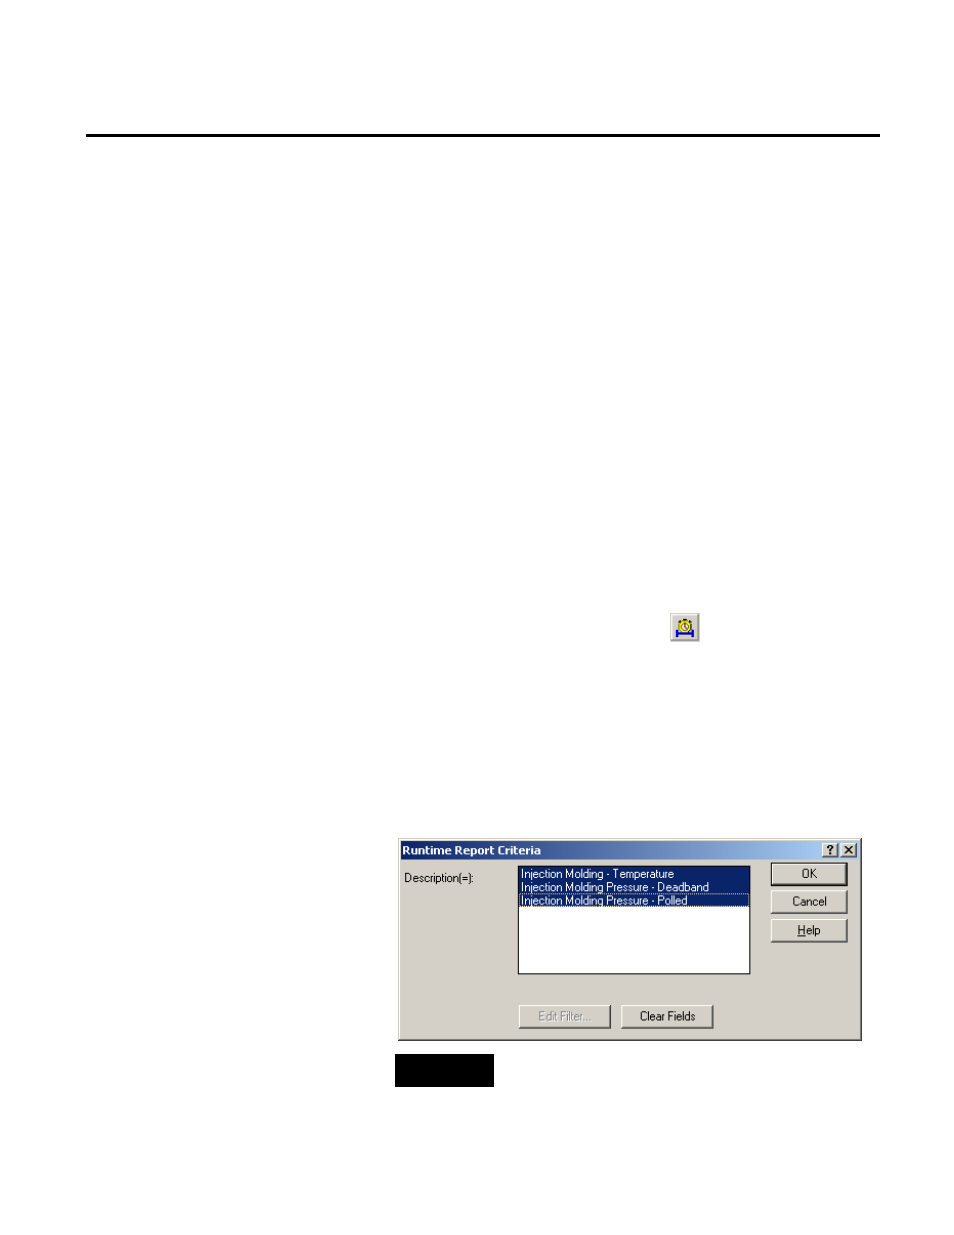
report object that contains a
required prompt-at-runtime filter,
the Runtime Report Criteria dialog box will appear. This is
the prompt that was created by the prompt-at-runtime filter.
This dialog box allows the users of your report object to specify
the values that will be displayed in the report object.
NOTE
If you did not select the Required check box in Step 8, the
preceding prompt would not appear.
Step 9: Insert Your New Chart
Into the Report
Rockwell Automation Publication HIST-UM001K-EN-E-June 2014
59