Rockwell Automation FactoryTalk Historian Classic User Guide User Manual
Page 133
Creating RSBizWare Custom Analysis Tools Chapter 7
Calculate()
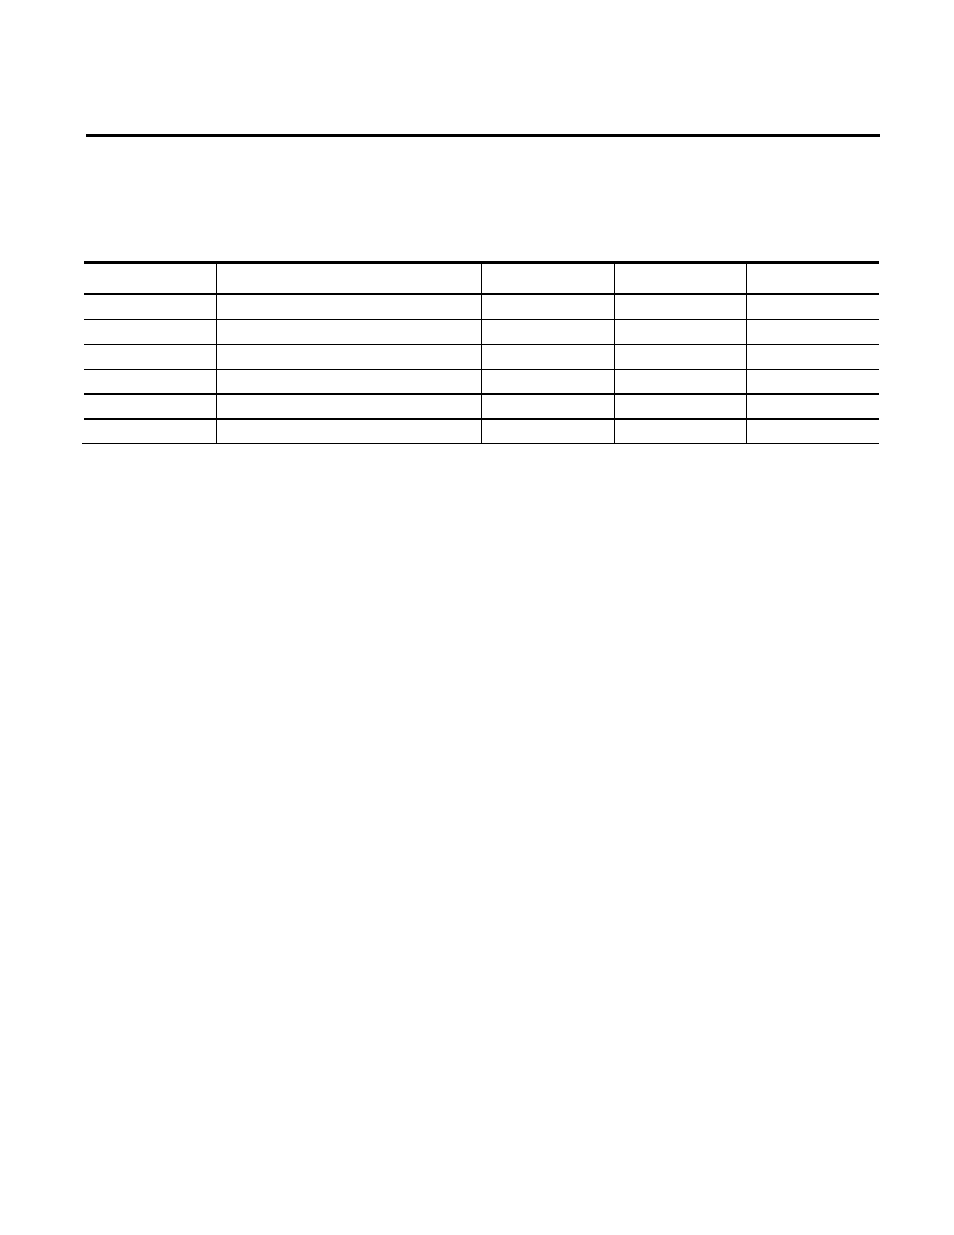
function you develop. The following table shows an
example of what an RSBizWare time-series data set looks like.
Data point
Timestamp
Min value
Max value
Sample count
Pressure
2000-06-20 07:00:00
7.5
8.3
360
Pressure
2000-06-20 08:00:00
8.3
9.5
360
Pressure
2000-06-20 09:02:00
8.5
9.5
360
Pressure
2000-06-20 10:03:00
9.5
13.4
360
Pressure
2000-06-20 11:04:00
13.4
17.5
360
Pressure
2000-06-20 12:05:00
17.5
16.1
360
When the Information Services Manager determines that there are
not enough records in the requested time-series data set to
necessitate sampling, the server will forego the sampling algorithm
and return the raw data point records to the client. In this case, the
minimum and maximum values will be identical and the count of
data points per sample record will be 1.
When you write a custom analysis tool, the time-series data set
parameters described above are passed into the
Calculate()
function you implement:
• X-Axis input array–This array contains double precision
floating point values, which are the X-axis values of the data
set. For time-series templates, the X-axis is always a set of date
values. Date values are represented in the Configuration
Console in COM DATE format, which means they are double
precision floating point values. You will typically not do
computations with X-axis values for time-series templates.
• Y-Axis Minimum input array–This array contains double
precision floating point values which are the minimum values
of each X-axis sample of the data set.
• Y-Axis Maximum input array–This array contains double
precision floating point values which are the maximum values
of each X-axis sample of the data set.
Interpreting the Parameters
Passed into the Calculate()
Function
Rockwell Automation Publication HIST-UM001K-EN-E-June 2014
133