Step 3: add reporting tags – Rockwell Automation FactoryTalk Historian Classic User Guide User Manual
Page 73
Analyzing FactoryTalk Historian Classic Data Chapter 4
When you save your report, the settings that you specified on the
Time Selection toolbar during report authoring will be saved with
the chart. These become the defaults for runtime users and they are
also used when you schedule the report object to be run at a later
date. Scheduling report objects and reports is discussed in Advanced
Reporting Topics (page 97).
NOTE
Although the Time Selection toolbar settings are used when you
schedule the report object, the scheduled output does not show the
Time Selection toolbar. To show the start and end times that are being
used in scheduled report objects, add start- and end-time dynamic text
fields to your report object. Refer to the Add Dynamic Text Fields To a
Report Object topic in the online help for the instructions to perform this
task.
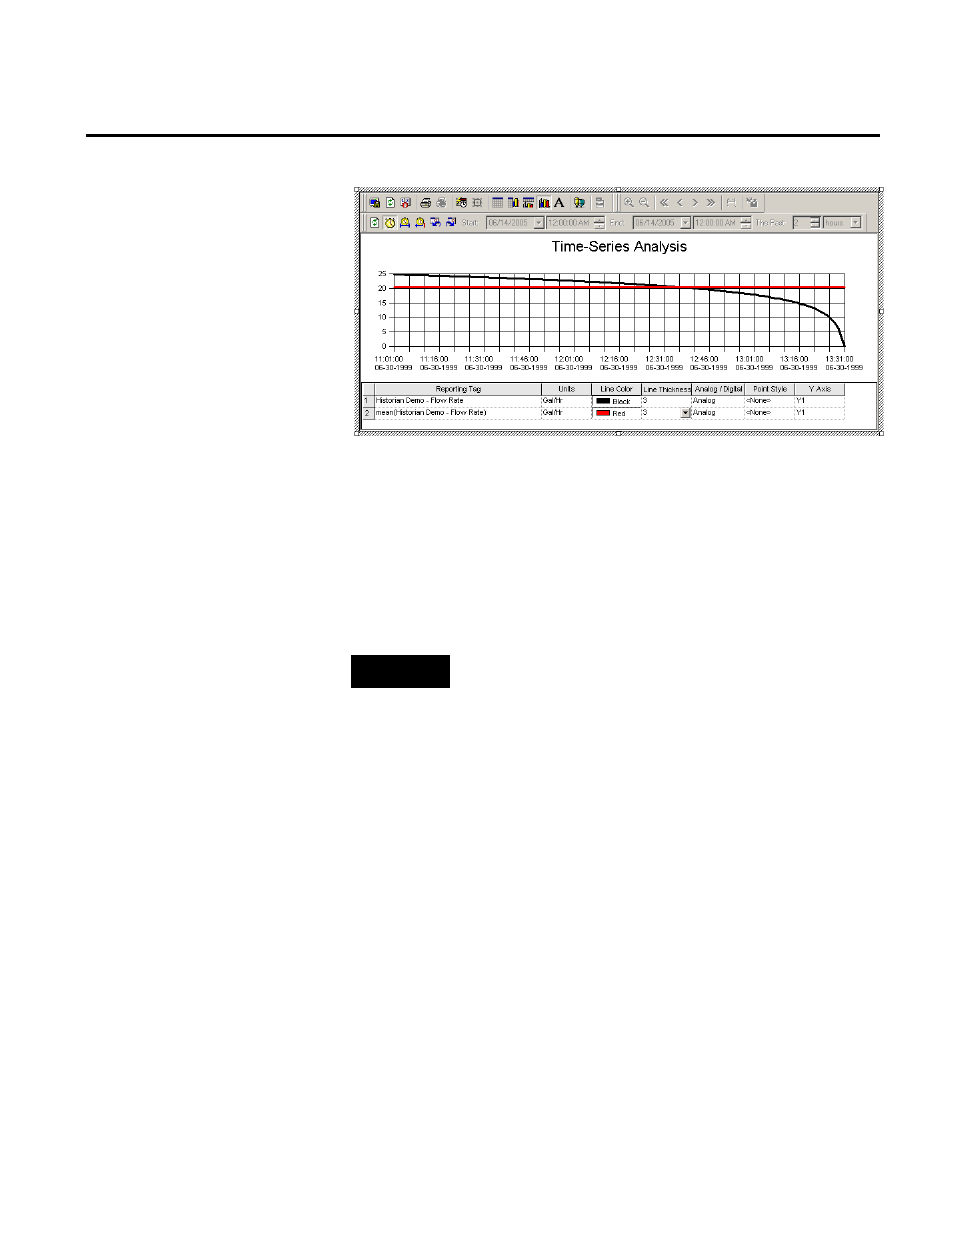
Now, let’s suppose we want to show the Flow Rate reporting tag and
the SUM(Flow Rate) analysis tool on a single chart. These two
reporting tags have very different value ranges; therefore, if we chart
the two reporting tags on the same Y-axis, the scaling of the graph
for SUM(Flow Rate) may distort the graph line for Flow Rate.
To isolate reporting tags or analysis tools with varying value ranges,
we can display one reporting tag on the original Y-axis, create a
second Y-axis on the same chart, and display the analysis tool on the
second Y-axis.
Step 3: Add Reporting Tags
Rockwell Automation Publication HIST-UM001K-EN-E-June 2014
73