11 setup program – JUMO 902931 Wtrans Receiver with Wireless Data Transmission Operating Manual User Manual
Page 88
11 Setup program
88
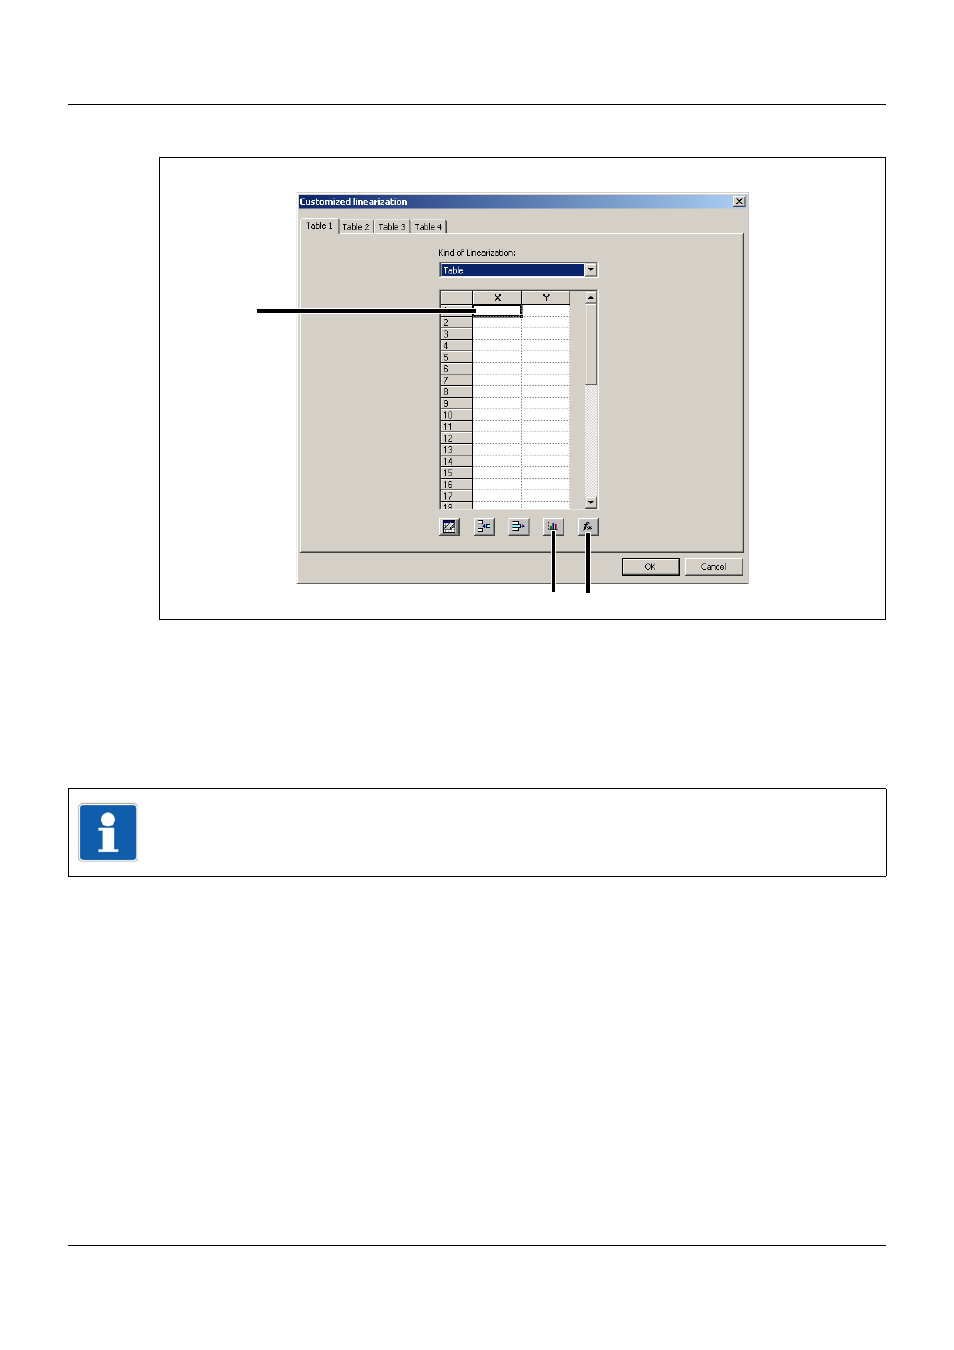
Table
Figure 38: Customized linearization – table
•
Enter the X and Y value pairs of the grid points in the fields (1).
•
Use button (2) to plot and check the linearization curve.
•
You can convert the entered grid points to a polynomial with button (3). The view automat-
ically changes from table to formula and you can switch between these. Both curves appear
in the plotted chart.
(1)
(2) (3)
TIP!
The device uses the type of linearization that is set when you click the OK button.
See also other documents in the category JUMO Equipment:
- 7050xx mTRON T - System description (10 pages)
- 705040 mTRON T - Router Module Operating Manual (74 pages)
- 705040 mTRON T - Router Module Installation Instructions (34 pages)
- 705030 mTRON T - Digital Input/Output Module Data Sheet (7 pages)
- 705030 mTRON T - Digital Input/Output Module Operating Manual (50 pages)
- 705021 mTRON T - Analog Input Module, 8-Ch. Data Sheet (8 pages)
- 705021 mTRON T - Analog Input Module, 8-Ch. Operating Manual (56 pages)
- 705020 mTRON T - Analog Input Module, 4-Ch. Data Sheet (10 pages)
- 705020 mTRON T - Analog Input Module, 4-Ch. Operating Manual (70 pages)
- 705015 mTRON T - Relay Module 4-Ch. Data Sheet (5 pages)
- 705015 mTRON T - Relay Module 4-Ch. Operating Manual (44 pages)
- 705010 mTRON T - Multichannel Controller Module Data Sheet (15 pages)
- 705010 mTRON T - Multichannel Controller Module Operating Manual (148 pages)
- 705001 mTRON T - Central Processing Unit Data Sheet (10 pages)
- 705001 mTRON T - Central Processing Unit Operating Manual (152 pages)
- 705060 mTRON T - Multifunction Panel 840 Data Sheet (13 pages)
- 705060 mTRON T - Multifunction Panel 840 Operating Manual (272 pages)
- 709062 TYA 202 - Three-Phase Power Controller Data Sheet (17 pages)
- 709062 TYA 202 - Three-Phase Power Controller Operating Manual (112 pages)
- 709061 TYA 201 - Single-Phase Power Controller Data Sheet (21 pages)
- 709061 TYA 201 - Single-Phase Power Controller Operating Manual (112 pages)
- 709050 IPC IGBT Power Converter Data Sheet (12 pages)
- 709050 IPC IGBT Power Converter IPC 200A Operating Manual (52 pages)
- 709050 IPC IGBT Power Converter IPC 70/100A Operating Manual (52 pages)
- 709050 IPC IGBT Power Converter IPC 70A Operating Manual (48 pages)
- 709040 TYA-110 thyristor power unit Data Sheet (12 pages)
- 709040 TYA-110 thyristor power unit Operating Manual (56 pages)
- 709020 TYA-432 thyristor power switch Data Sheet (5 pages)
- 709010 TYA-432 thyristor power switch Data Sheet (3 pages)
- 706585 LOGOSCREEN fd Data Sheet (21 pages)
- 706585 LOGOSCREEN fd Operating Instructions (108 pages)
- 706585 LOGOSCREEN fd Operating Manual (228 pages)
- 706585 LOGOSCREEN fd Recorder with diecast zinc front Installation Instructions (40 pages)
- 706585 LOGOSCREEN fd Recorder with stainless steel front Installation Instructions (52 pages)
- 706581 LOGOSCREEN nt Data Sheet (18 pages)
- 706581 LOGOSCREEN nt Operating Instructions (108 pages)
- 706581 LOGOSCREEN nt Operating Manual (224 pages)
- 706581 LOGOSCREEN nt Paperless Recorder with TFT display, CompactFlash Installation Instructions (36 pages)
- 706581 LOGOSCREEN nt stainless steel front Installation Instructions (48 pages)
- 706560 LOGOSCREEN es Data Sheet (12 pages)
- 706560 LOGOSCREEN es Operating Instructions (64 pages)
- 706560 LOGOSCREEN es Operating Manual (128 pages)
- 706560 LOGOSCREEN es Installation Instructions (32 pages)
- 706510 LOGOSCREEN 500 cf Data Sheet (10 pages)
- 706510 LOGOSCREEN 500 cf Operating Manual (140 pages)