In-Situ TROLL 9500 Operators Manual User Manual
Page 51

44
TROLL 9500 Operator’s Manual
0095110 rev. 007 01/09
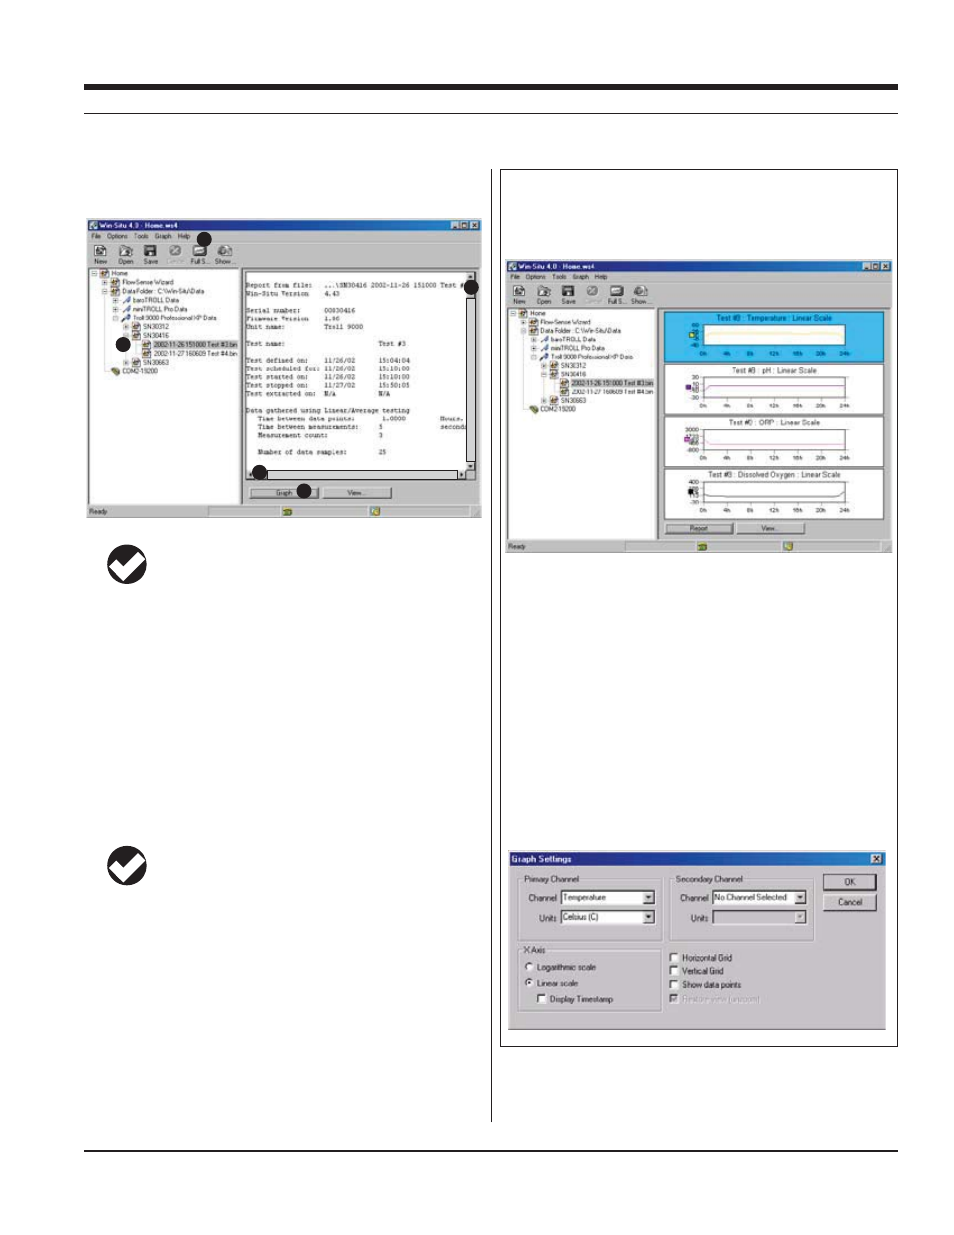
Win-Situ Graphing Controls
The Graph button displays data from the first four test channels in graph
format. Time is shown on the X axis in the currently selected unit. The
axes are auto-ranged. Click any graph to select it for formatting.
Each graph can display one, two, or all test channels. To change the ap-
pearance and content of any graph, display the Graph menu or right-click
a graph. This provides access to the graph formatting options:
s
s
s
s
s
s
s
s
Many of these options can be set in the Graph settings window:
The selected test is displayed in the Information pane—to the right
of the screen in Win-Situ, or at the bottom in Pocket-Situ.
TIP: The data file may appear in Report view or Graph view,
depending on the preferences saved in your last Win-Situ or
Pocket-Situ session.
5. To view the test data below the header in Report view:
s
data file.
s
play, and then use the scrollbars.
GRAPHING DATA
6. Click or tap Graph to display the individual parameter data in
graph format. See the sidebar on this page for Win-Situ graphing
controls, and on the next page for Pocket-Situ graphing controls.
TIP: You can easily switch from Graph view to Report view
and back using the Graph and Report buttons in the Infor-
mation pane. However, the view chosen in this way is not
“persistent” into your next session. To change the view so it always
comes up as Graph or Report, specify the desired Data File View in
Preferences (Options Menu) in Win-Situ or Setup in Pocket-Situ.
Win-Situ provides a range of options for viewing data in graph
format. Here are some things you may wish to try:
s
go to the Graph menu and select a different Number of Graphs
s
Graph menu, select a Primary channel and a Secondary Channel
s
Graph menu, choose All Channels Selected
SECTION 6: LOGGING DATA
4
5
6
5
5
