Q: a – In-Situ TROLL 9500 Operators Manual User Manual
Page 41

34
0095110 rev. 007 01/09
TROLL 9500 Operator’s Manual
Q:
A:
Can I see Dissolved Oxygen readings in mg/L and %
saturation at the same time?
Yes, so long as your preferred unit for DO is mg/L. Select
Dissolved Oxygen for one window, and Dissolved Oxygen
% Saturation for another window.
CUSTOMIZING THE PROFILER
Changing the Channels Displayed
The arrow
below each Profiler reading displays a drop-down list
that may be used to assign a different channel to each position, if
desired. You can use this button to add a channel, such as RDO Opti-
cal Dissolved Oxygen, that is not displayed by default. However, only
8 channels can be shown.
Changing Measurement Units
Close the Profiler. In Win-Situ, select Preferences on the Options
menu. In Pocket-Situ, select the Home site, then tap Setup in the
command bar.
Changing the Sample Rate
Close the Profiler. In Win-Situ, select Preferences on the Options
menu, then select the Settings tab. In Pocket-Situ, select the Home
site, tap Setup in the command bar, then select the Settings tab. You
may select any sample rate between 2 and 60 seconds.
Starting in Profiler Mode
In Win-Situ, select Preferences on the Options menu, then select the
Settings tab. In Pocket-Situ, select the Home site, tap Setup in the
command bar, then select the Settings tab. Check Start application
in Profiler mode. This will take effect at your next session (or exit and
re-start to apply this setting).
LOGGING PROFILER DATA
Profiler data may be logged to the connected PC while in the “Meter”
view.
s
SnapShot button in the “Meter” view.
s
ous button in the “Meter” view. Readings will be logged until you
cancel the operation by clicking Stop Log.
TO STOP LOGGING
The Snapshot function logs a single set of readings and stops logging
automatically.
In Continuous mode, click Stop Log. Note that this does not stop
Profiling; readings will continue to be updated on the screen.
RETRIEVING LOGGED PROFILER DATA
In either Snapshot or Continuous mode, Profiler data are logged to
the connected PC and accessible through the Data Folder. The data
may be retrieved at any time. A connection to the instrument is not
necessary.
To retrieve logged Profiler data:
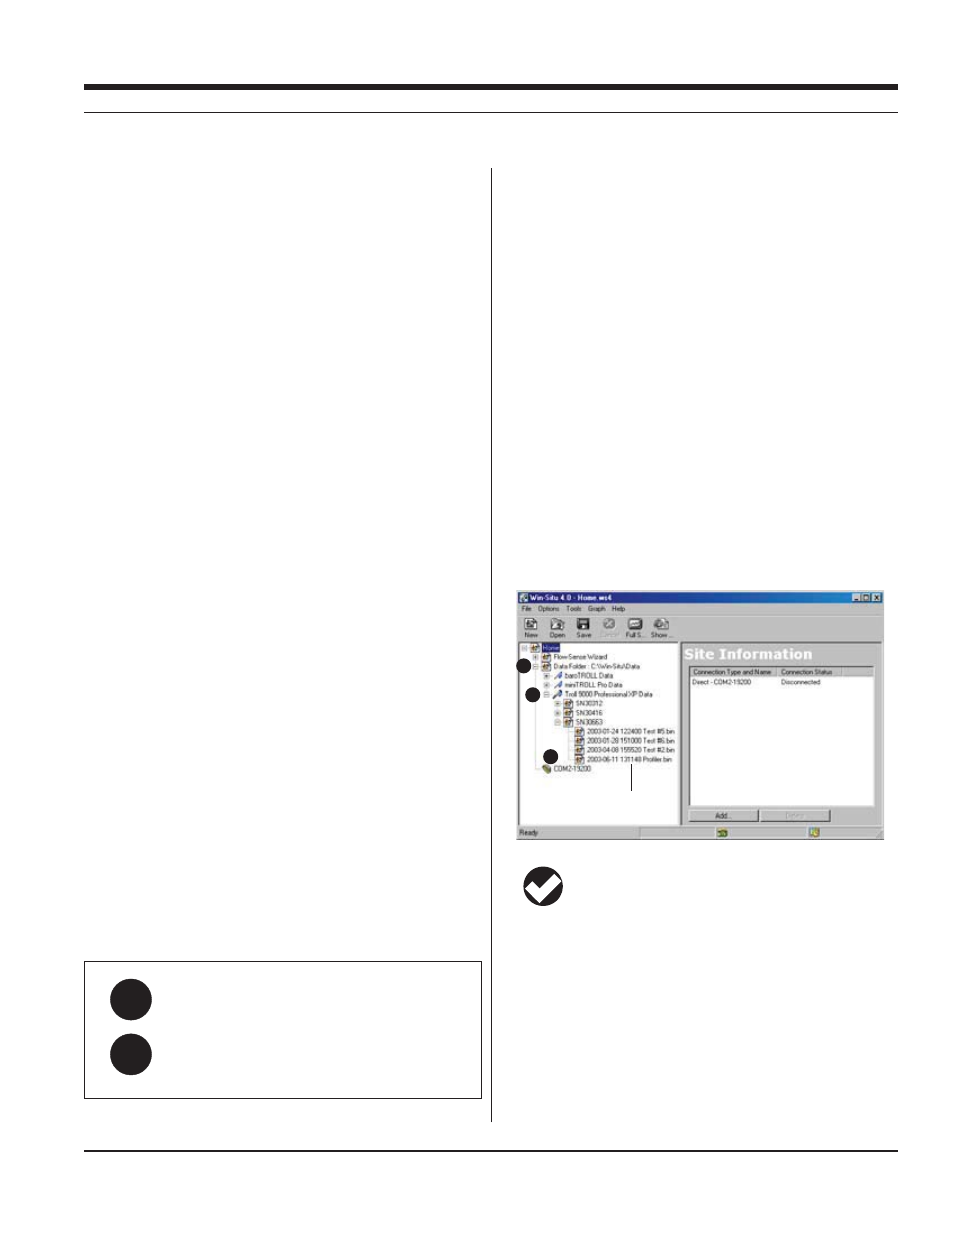
1. Expand the Data Folder in the Navigation tree by tapping the +.
2. Expand the node for the device type and serial number.
3. Look for a data file named with date and time of the profiler read-
ing, and with the ending profiler.bin—or whatever custom name you
may have specified when starting the Profiler.
TIP: The time shown in the filename of a Profiler log is the
time the Profiler started, which may be different from the
time of the first data point logged. Similarly, the Elapsed
Time indicated in the Report view of a continuous Profiler log is the
elapsed time since the Profiler started.
For additional information on viewing data in the Data Folder, see the
section “Viewing Logged Data” at the end of Section 6 below.
EXITING THE PROFILER
When you are ready to exit the Profiler, click Close. The Parameters
view will return to the screen.
SECTION 5: PROFILING
Logged Profiler data
1
2
3
