Nsensor wellness, Nlast calibrated, Ncalibration due – Yokogawa 2-Wire Dual Channel Transmitter/Analyzer FLXA21 User Manual
Page 88: Nprojected replacement
<6. OPERATION OF SC (Conductivity)>
6-8
IM 12A01A02-01E
5th Edition : Oct. 31, 2013-00
n
Sensor wellness
At the Sensor wellness window, the soundness of a module is displayed. A larger number of n
in each gauge indicates that the parameter concerned is sound. A gauge is indicated for only
those parameters whose sensor wellness setting is “enabled,” while a bar (----) is displayed if the
sensor wellness setting is “disabled.”
Sensor wellness setup can be made in Commissioning → Measurement setup → Sensor diag.
settings. For details, see section 7.1.7.
The “Reset wellness data” button can reset wellness data.
When a sensor is exchanged or replaced, sensor wellness data should be reset.
NOTE
When a sensor is replaced, the replacement can be recorded manually into a logbook. (Refer to
the figure 6.8.)
n
Last calibrated
= date on which the last sensor calibration was performed. The displayed value of the Zero is the
result of this calibration. The displayed value of Slope was calibrated on this date only if the last
calibration was a 2-point calibration.
n
Calibration due
= the date when the calibration must be done next according to the settings of the calibration
interval. The calibration intervals are set in Commissioning → Measurement setup → Calibration
settings → Limits and timing.
n
Projected replacement
The projected maintenance function predicts the date when the sensor unit will need cleaning or
recalibrating for maintaining measurement accuracy. This function checks the cleanliness of the
sensor by monitoring the polarization of the electrodes every 24 hours and the cell constant after
the calibration. Clean the sensor before the predicted date.
The function predicts the following two dates:
• When the cell constant crosses the upper or lower limits
• When the value of the polarization of the electrodes reaches the alarm point (15% or more).
The function displays the earlier date with the status (the status is displayed in parentheses).
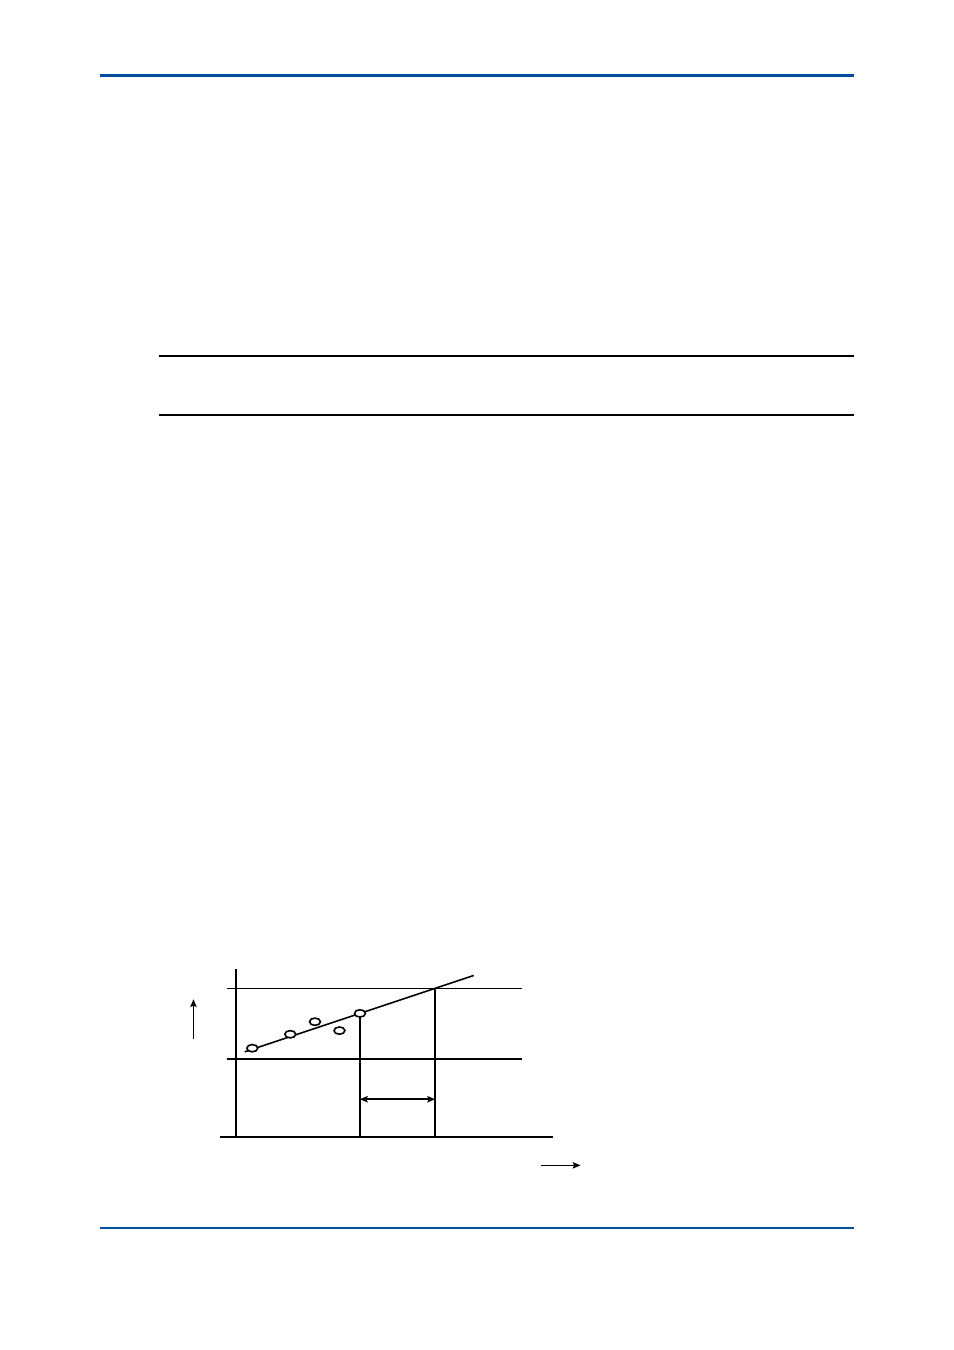
As shown in Figure 6.7, the date is predicted based on the intersection point of the upper or lower
limits and the extrapolated line of the values obtained by the least squares method.
Day
Value
Lower limit
Upper limit
Current
date
Projected
maintenance date
F0310.ai
Figure 6.7