5 trend graphics, Trend graphics -10 – Yokogawa 2-Wire Dual Channel Transmitter/Analyzer FLXA21 User Manual
Page 52
<3. OPERATION OF pH/ORP>
3-10
IM 12A01A02-01E
5th Edition : Oct. 31, 2013-00
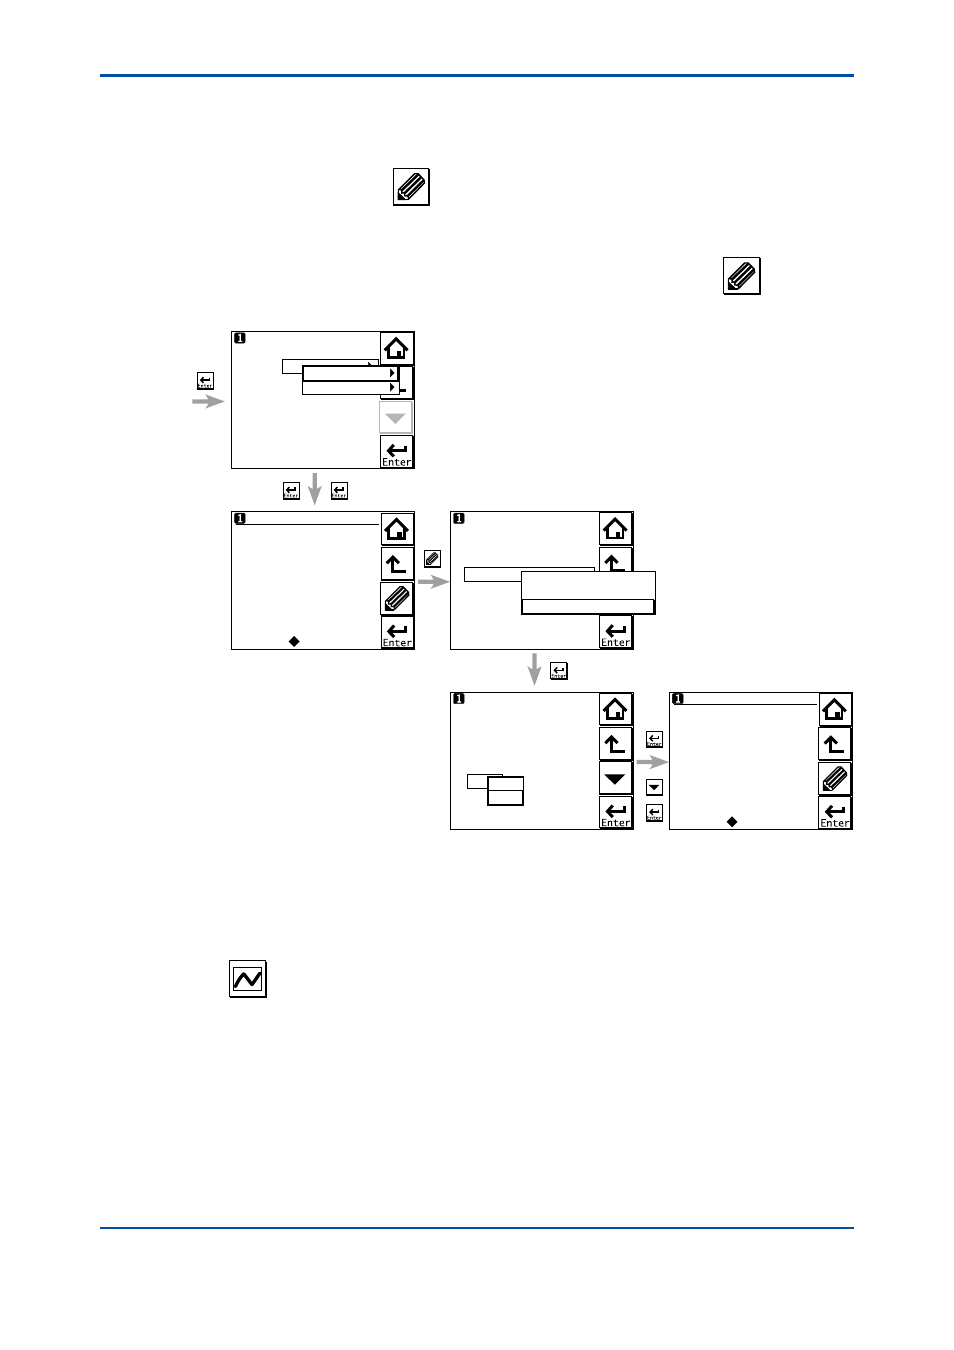
History information on events are automatically stored on the preset conditions.
In addition to this storing, following three messages can be manually stored in the logbook;
"Sensor washed by hand", "Module replaced", "Sensor replaced"
To store these messages, press
and select one of three messages from the Item on the
Memorandum screen. Its event date/time will be the time when a message is selected and
entered.
When a password for Commissioning is set on the passwords’ setup, pressing
requires
entering the password. (Refer to the section 4.6.3.)
Read Logbook:
logbook1-1
Memorandum:
Item
Sensor washed by hand
Enter?
No
logbook1-1 1/1
Memorandum:
Item
Sensor replaced
Enter?
No
2010/02/15 17:04
Sensor replaced
2010/02/15 15:15
Power on
Finish
2010/02/15 15:15
Power on
Finish
logbook1-1 1/1
** When storing message manually.
**
(Fig.3.6)
Sensor washed by hand
Module replaced
Sensor replaced
logbook1-1
logbook1-2
No
Yes
Figure 3.9
Detail display (continued)
3.5
Trend graphics
Pressing
on the Zoom display changes the display to a graphical mode in which the
average measured value is shown on a time scale. The “Live” value is also digitally displayed in
a text box. The time scale (X-axis) and the primary value scale (Y-axis) are set in the “DISPLAY
SETUP” menu (Section 4.7.2).
The screen displays the trend of up to 41 averages of the measurement for each time interval.
The FLXA21 samples the measurements every second. The trending graphic also shows the
maximum and minimum measured values in that interval.
For example, if the time scale is set to 4 hours, then the trend is shown for 4 hours prior to the
actual measurement. Each point on the trend line represents the average over 4Ч60Ч60/41 =
351 measurements (seconds).