App.4-2, Nchanging the settings – Yokogawa 2-Wire Dual Channel Transmitter/Analyzer FLXA21 User Manual
Page 241
App.4-2
IM 12A01A02-01E
5th Edition : Oct. 31, 2013-00
Table 2 Solubility of oxygen in water as a funstion of temperature and pressure
Temperature
(°C)
Pressure [kPa (atm) *
1
]
111.5 (1.1) 101.3 (1.0) 91.2 (0.9) 81.1 (0.8) 70.9 (0.7) 60.8 (0.6) 50.7 (0.5)
Solubillity (mg/l)
0.0
5.0
10.0
15.0
16.09
14.06
12.43
11.10
13.14
11.48
10.15
9.05
11.69
10.20
9.00
8.03
10.21
8.91
7.86
7.01
8.74
7.62
6.71
5.98
8.74
7.62
6.71
5.98
7.27
6.34
5.58
4.96
20.0
25.0
30.0
35.0
40.0
10.02
9.12
8.35
7.69
7.10
8.14
7.40
6.76
6.22
5.72
7.23
6.56
5.99
5.47
5.03
6.30
5.70
5.19
4.75
4.34
5.37
4.84
4.60
4.01
3.65
5.37
4.84
4.60
4.01
3.65
4.44
4.00
3.62
3.28
2.96
ISO 5814:1990(E)
*1:
Units at standard barometric pressure (normal atmospheric pressure at sea level): 101.325 kPa = 101.325 kN/m
2
= 1 atm = 760
mmHg
Table 3 Variation of atmospheric pressure with respect to altitude
Altitude (m) Mean atmospheric pressure (kPa)
0
100
200
300
400
101.3
100.1
98.8
97.6
96.4
500
600
700
800
900
1000
95.2
94.0
92.8
91.7
90.5
89.4
1100
1200
1300
1400
1500
88.3
87.2
86.1
85.0
84.0
1600
1700
1800
1900
2000
2100
82.9
81.9
80.9
79.9
78.9
77.9
ISO 5814:1990(E)
n
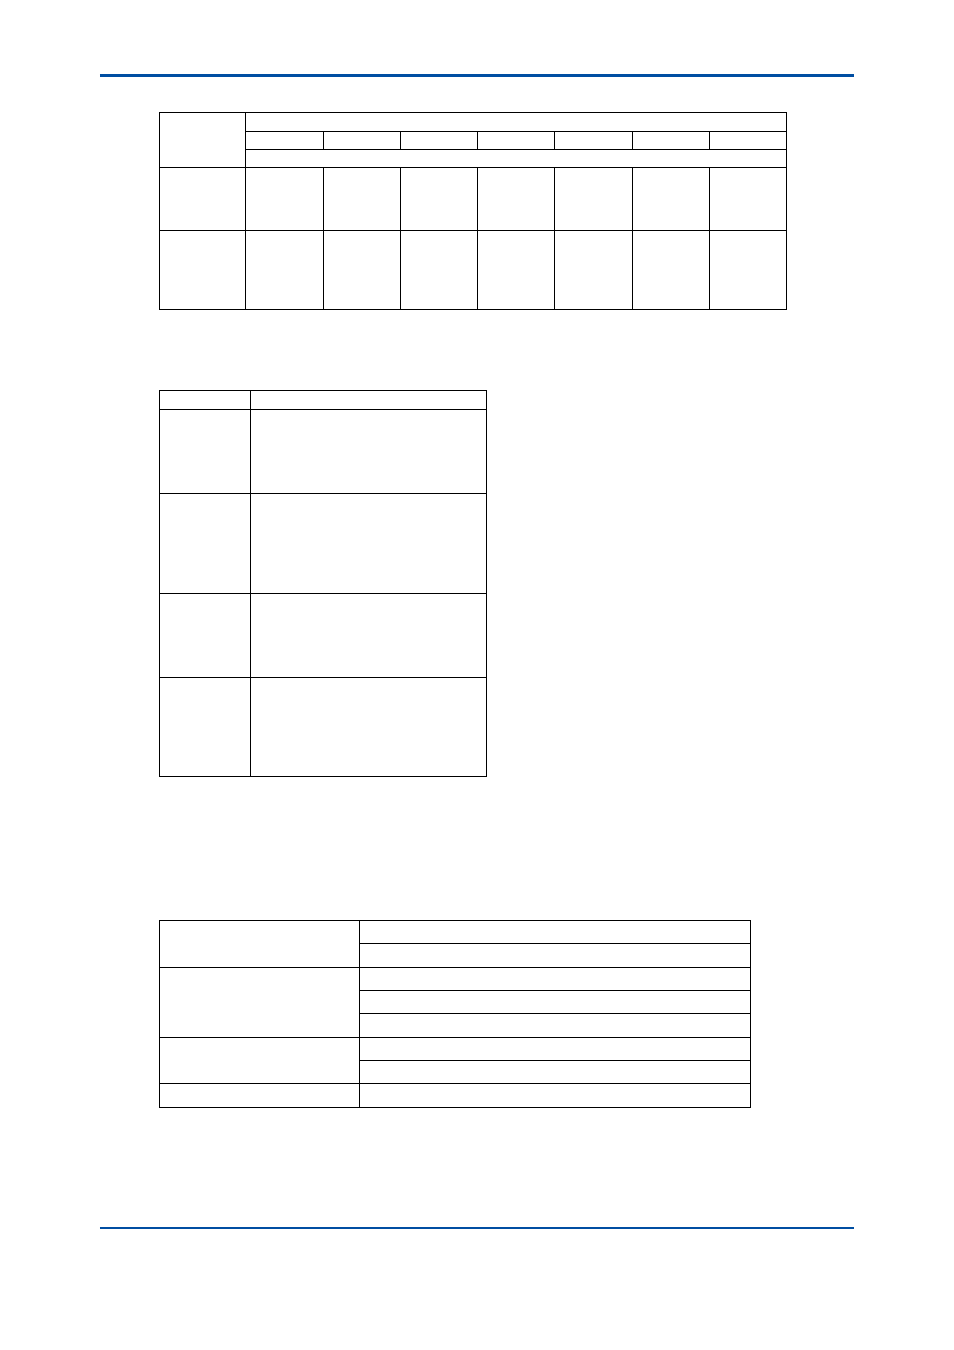
Changing the settings
If any setting is accidentally changed, values to the right of the relevant arrow in Table 4 are all
initialized.
Table 4 Parameters that initialize other values
Sensor type ->
Sensor sensitivity
Calibration settings: Limits and timing: Zero, Slope (low, high)
Output: Process parameter -> Linear: 0% value, 100% value
Table
Communication: HART: PV
Trend Graph Screen ->
Y-axis (low, high)
Communication: HART
Configure sensor: Unit ->
Trend: Y-axis: Limits: Oxygen (low, high)